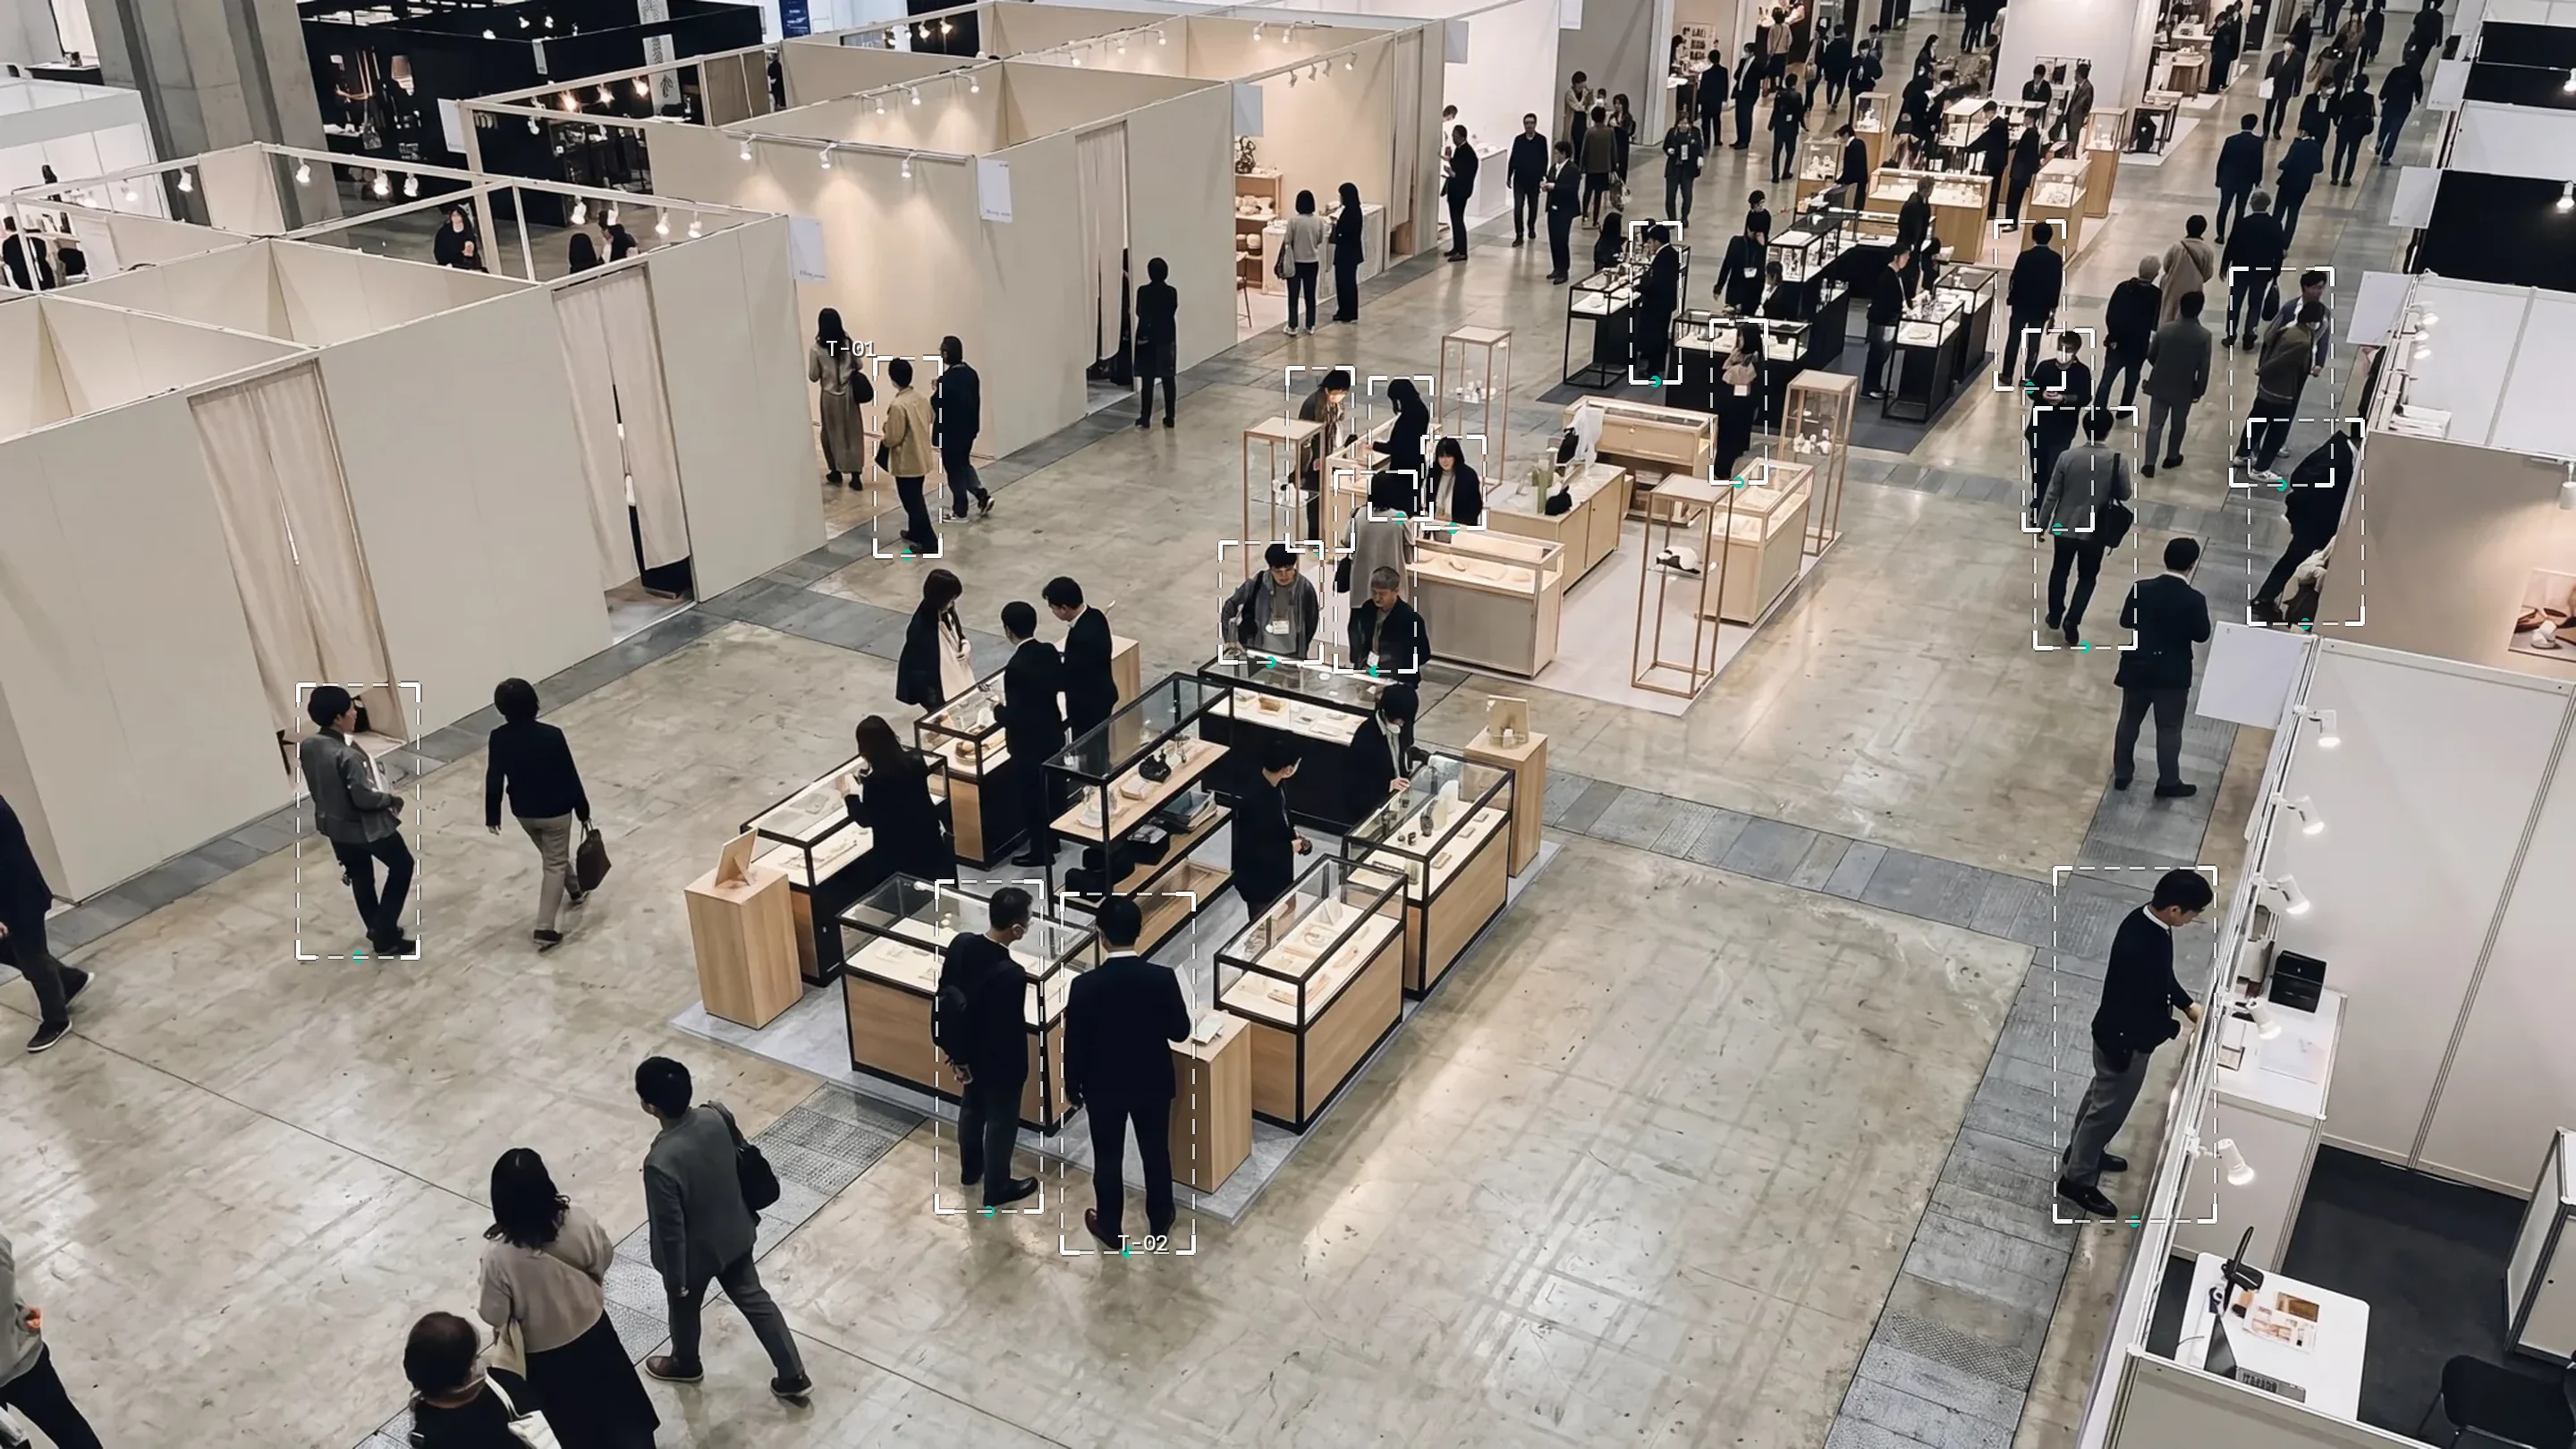
Is visitor count all your report has?
How visitors move and where they look, measured
with slim cameras and delivered as precise data.
Every behavior pattern on the event floor, made visible
From everyone who passed the booth to everyone who stopped inside a zone, gathered by zone for the report.
How many people passed the booth, hour by hour.
Which zones held a gaze and stopped a step.
Which staging and which products actually stopped people.
When crowds build and clear, fed back into operations.
Measured on the same definitions and compared with last time.
What you learn
EventVision measures where visitors move and where they stop across exhibitions and pop-ups. The numbers come back as Excel originals, a dashboard, and a report that names what to change for the next run.
- Male55%
- Female45%
- -175%
- 18-2945%
- 30-3934%
- 40-4913%
- 50-593%
- 60+<1%
Materials in multiple formats, ready for your report
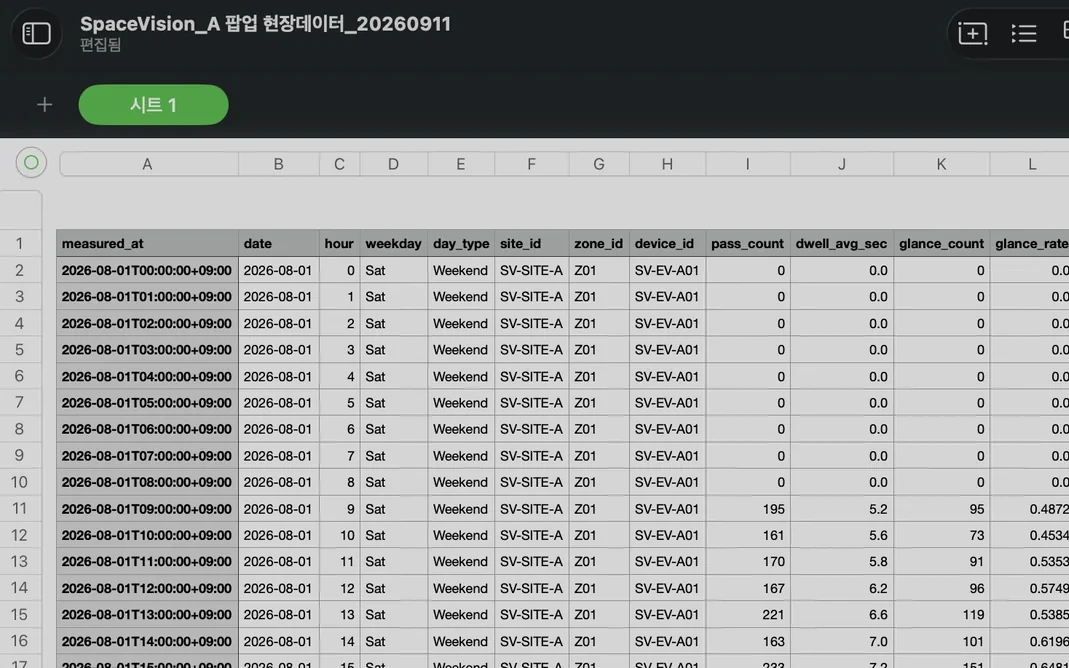
Raw data with every measurement variable included, ready to hand to an AI model for analysis.
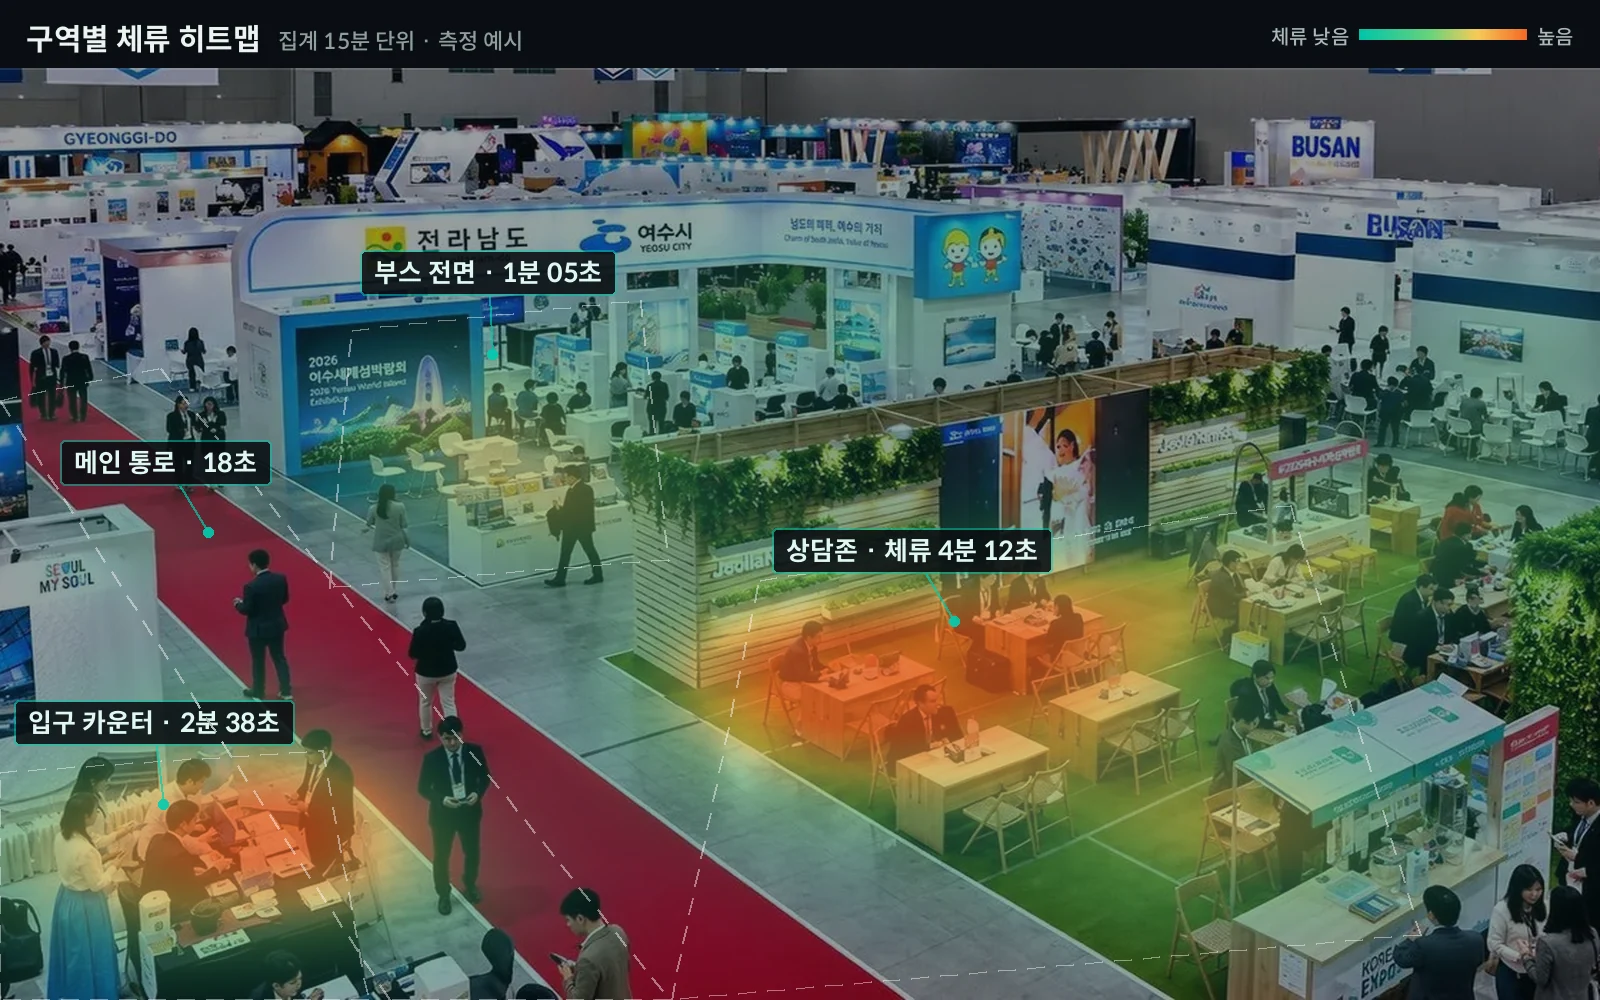
The data on where interest gathers and where it thins out, handed over as plain visuals such as a heatmap.
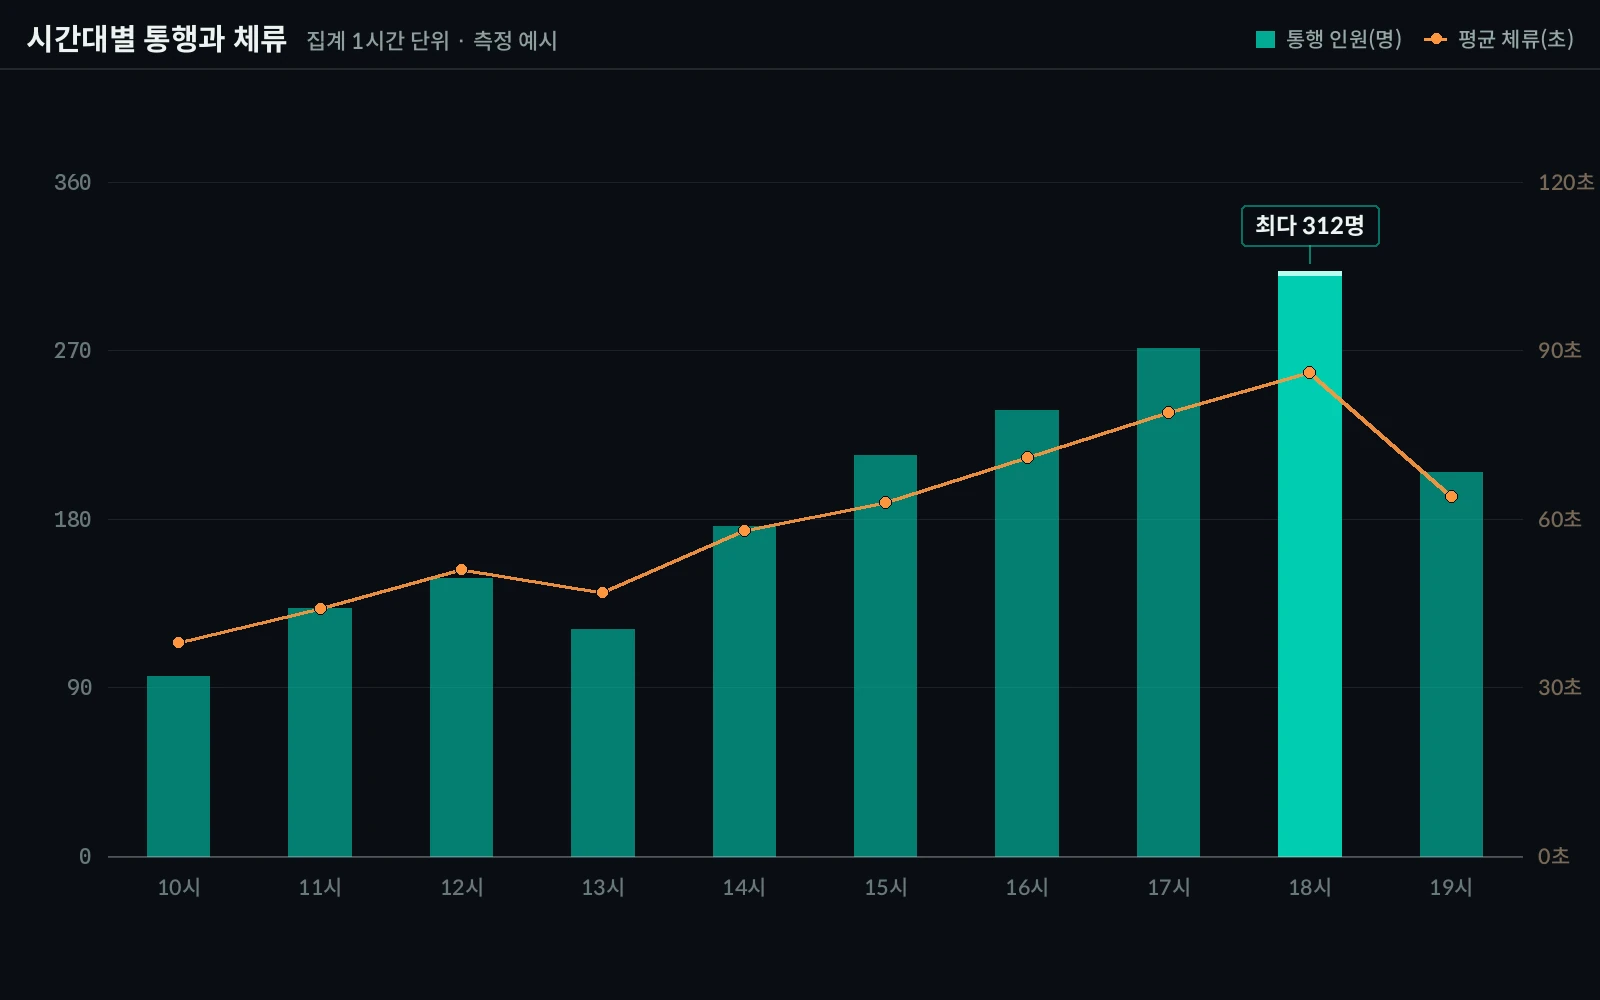
Read when crowds build and when they clear, hour by hour, and act on it on site.
The raw data is a capture of a real deliverable (identifying details removed). The heatmap and the hourly chart are the same deliverables redrawn with example figures.
More than statistics: insight you can act on
From an expert's view, we propose concrete plans for your next event.
- Data
- Weekends 2–3 pm: a bottleneck formed in Zone B.
- Action
- Spread the entry path to the right and add two guide staff to Zone B in that hour.
- Data
- Zone A drew the most traffic (12K) but the least attention (8%); goods in Zone C drew the most (45%).
- Action
- From day 3, swap the VMD in Zones A and C to lengthen dwell.
- Data
- Of 8,500 people passing the photo zone, 6,200 (72%) looked at the logo for 10+ seconds.
- Action
- Report measured brand exposure to some 6,000 target visitors to your sponsor.
ValueClean data ready for your report, plus a plan for the actions that create change.
From the site survey to teardown, run step by step
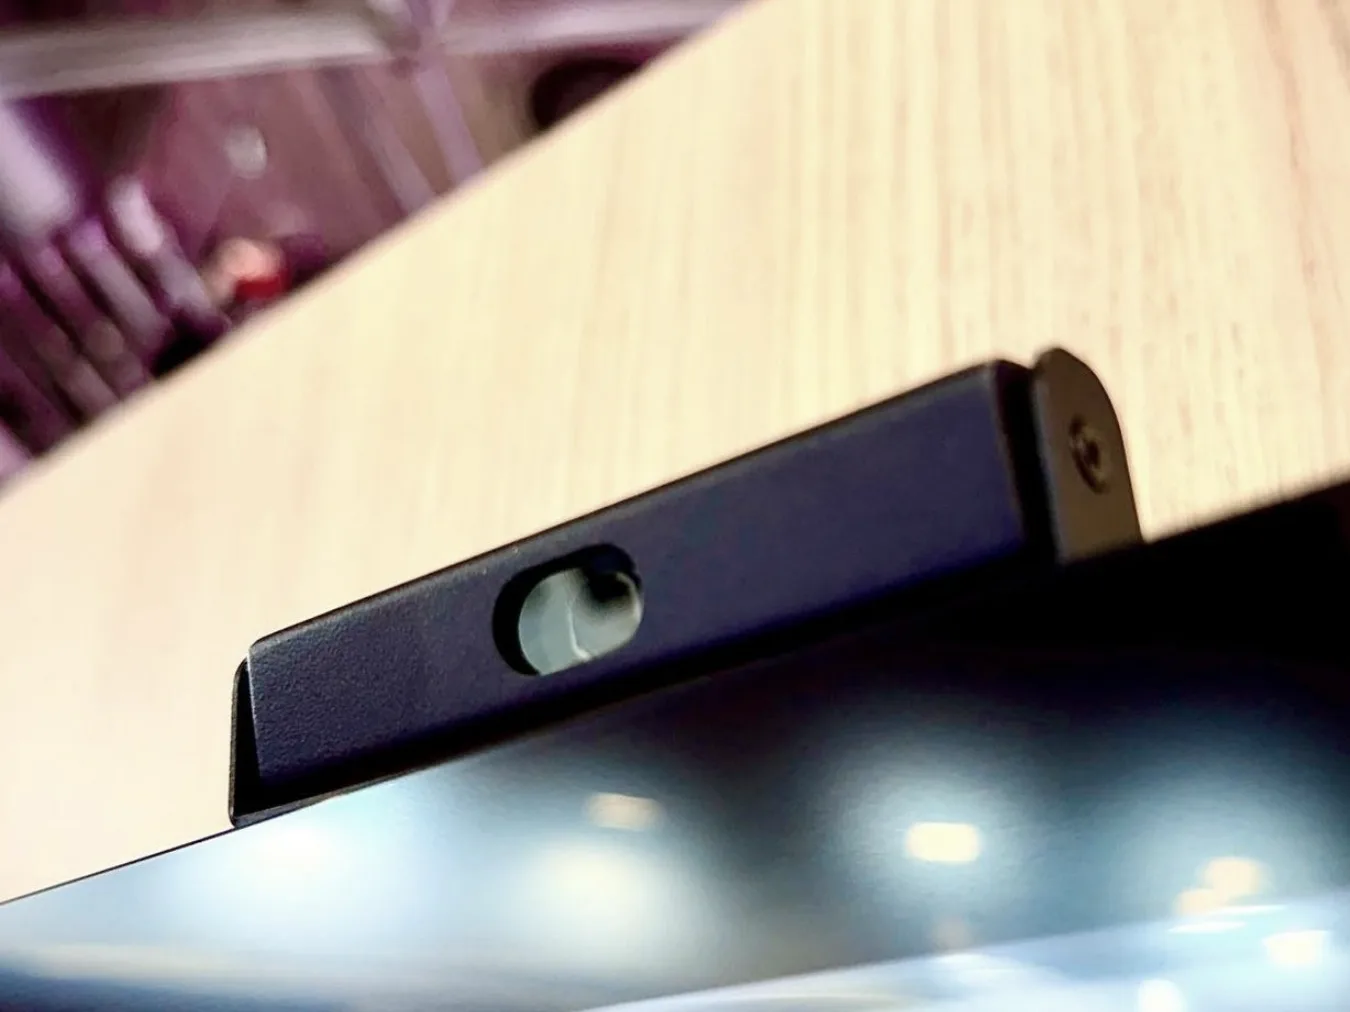
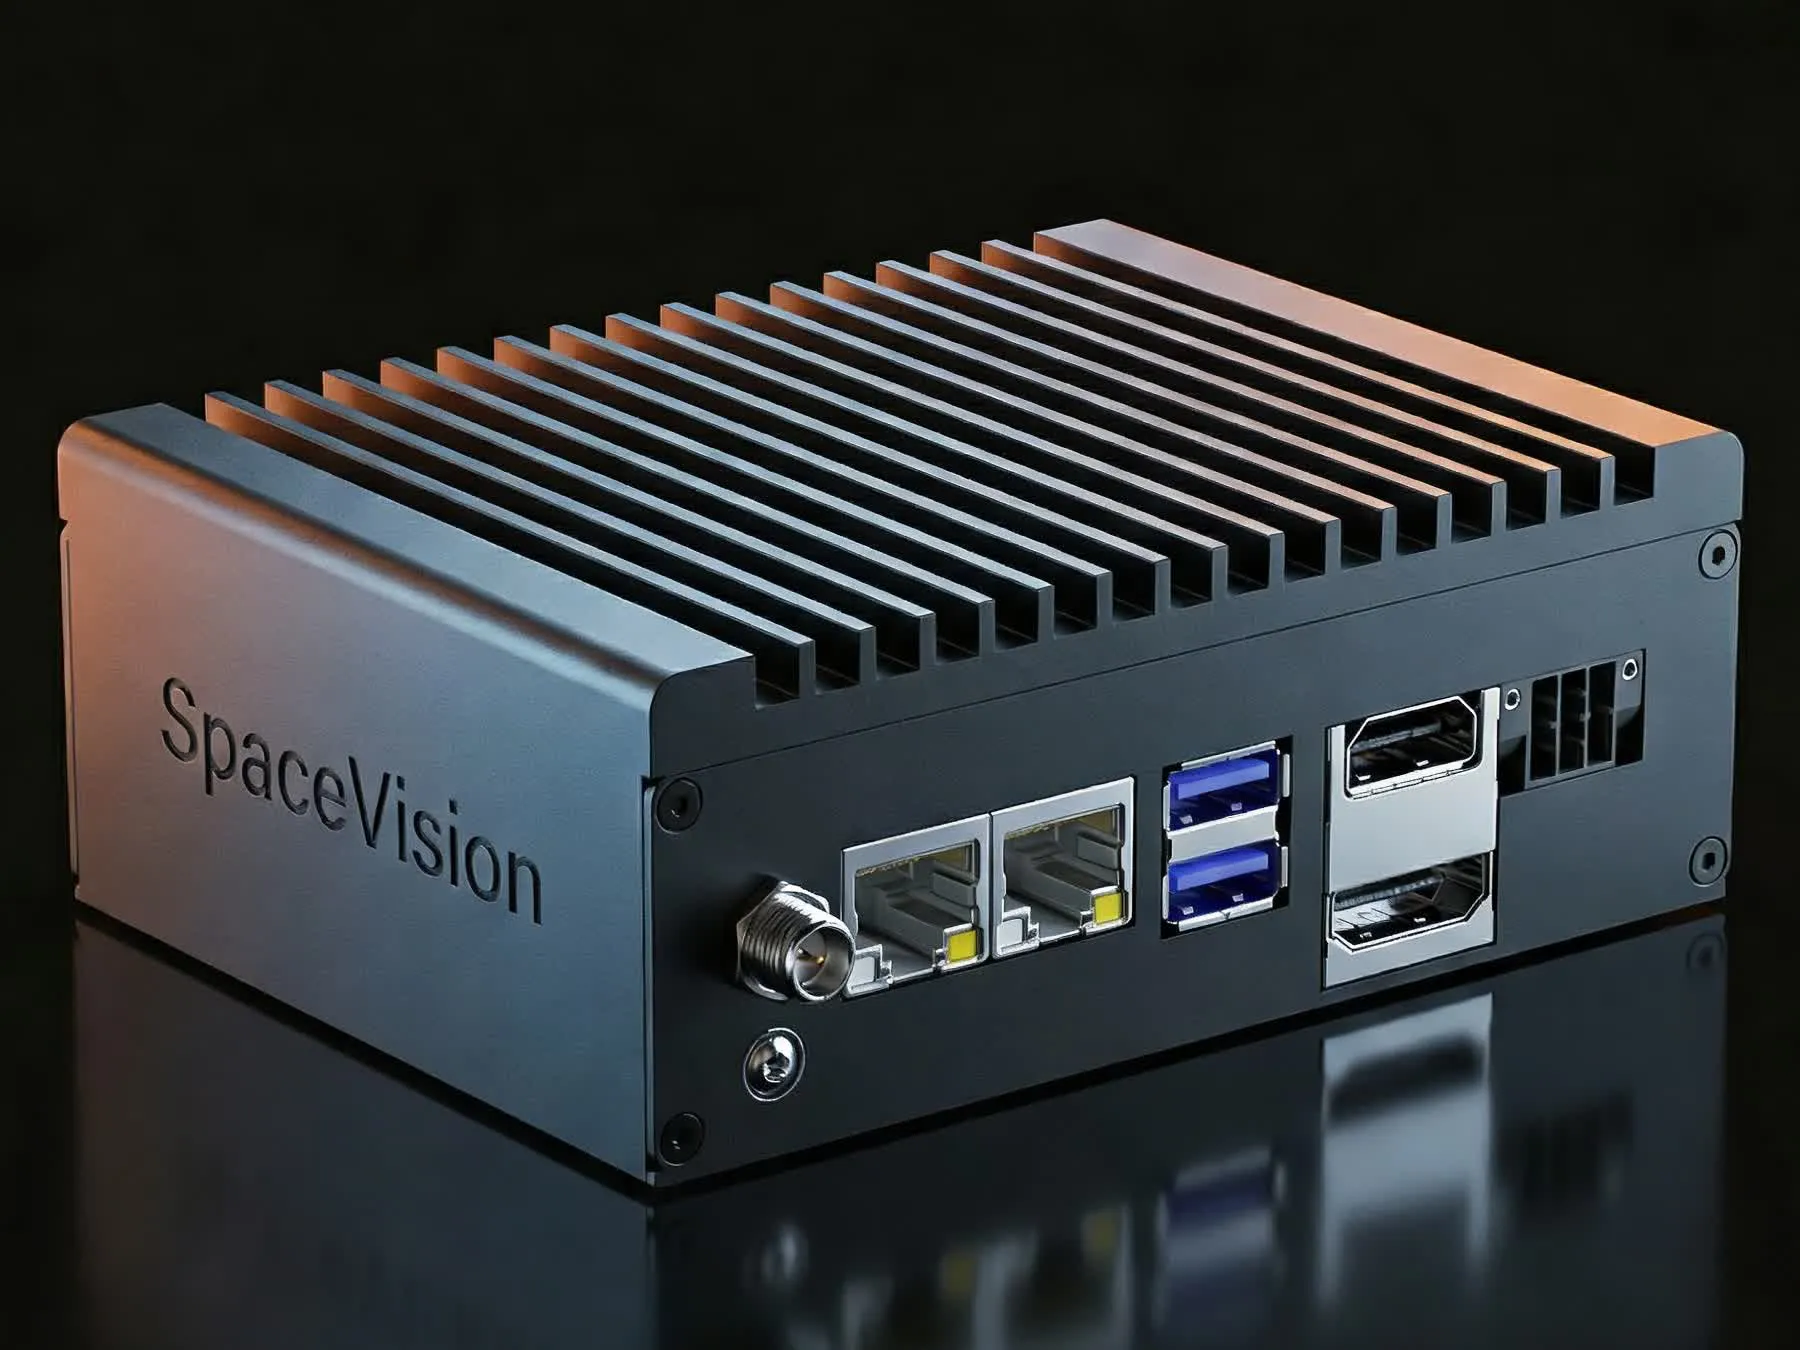
Slim cameras and an AI Box are placed to suit the site. Where CCTV already exists in the space, that feed can be used as it is.
Events start from 3 days, permanent stores from 1 month.
We set the hypothesis and success criteria, then check the camera and AI Box setup.
A standard quote based on camera count, measurement period and choice of metrics.
We measure across the agreed period and deliver raw data and the dashboard.
- Setup and coverage review
- Measured data by zone
- KPI dashboard and zone results
- Action items and the reasoning
Measured without leaving a trace
Placed so they do not spoil the look of the space, and measuring without disrupting operations.
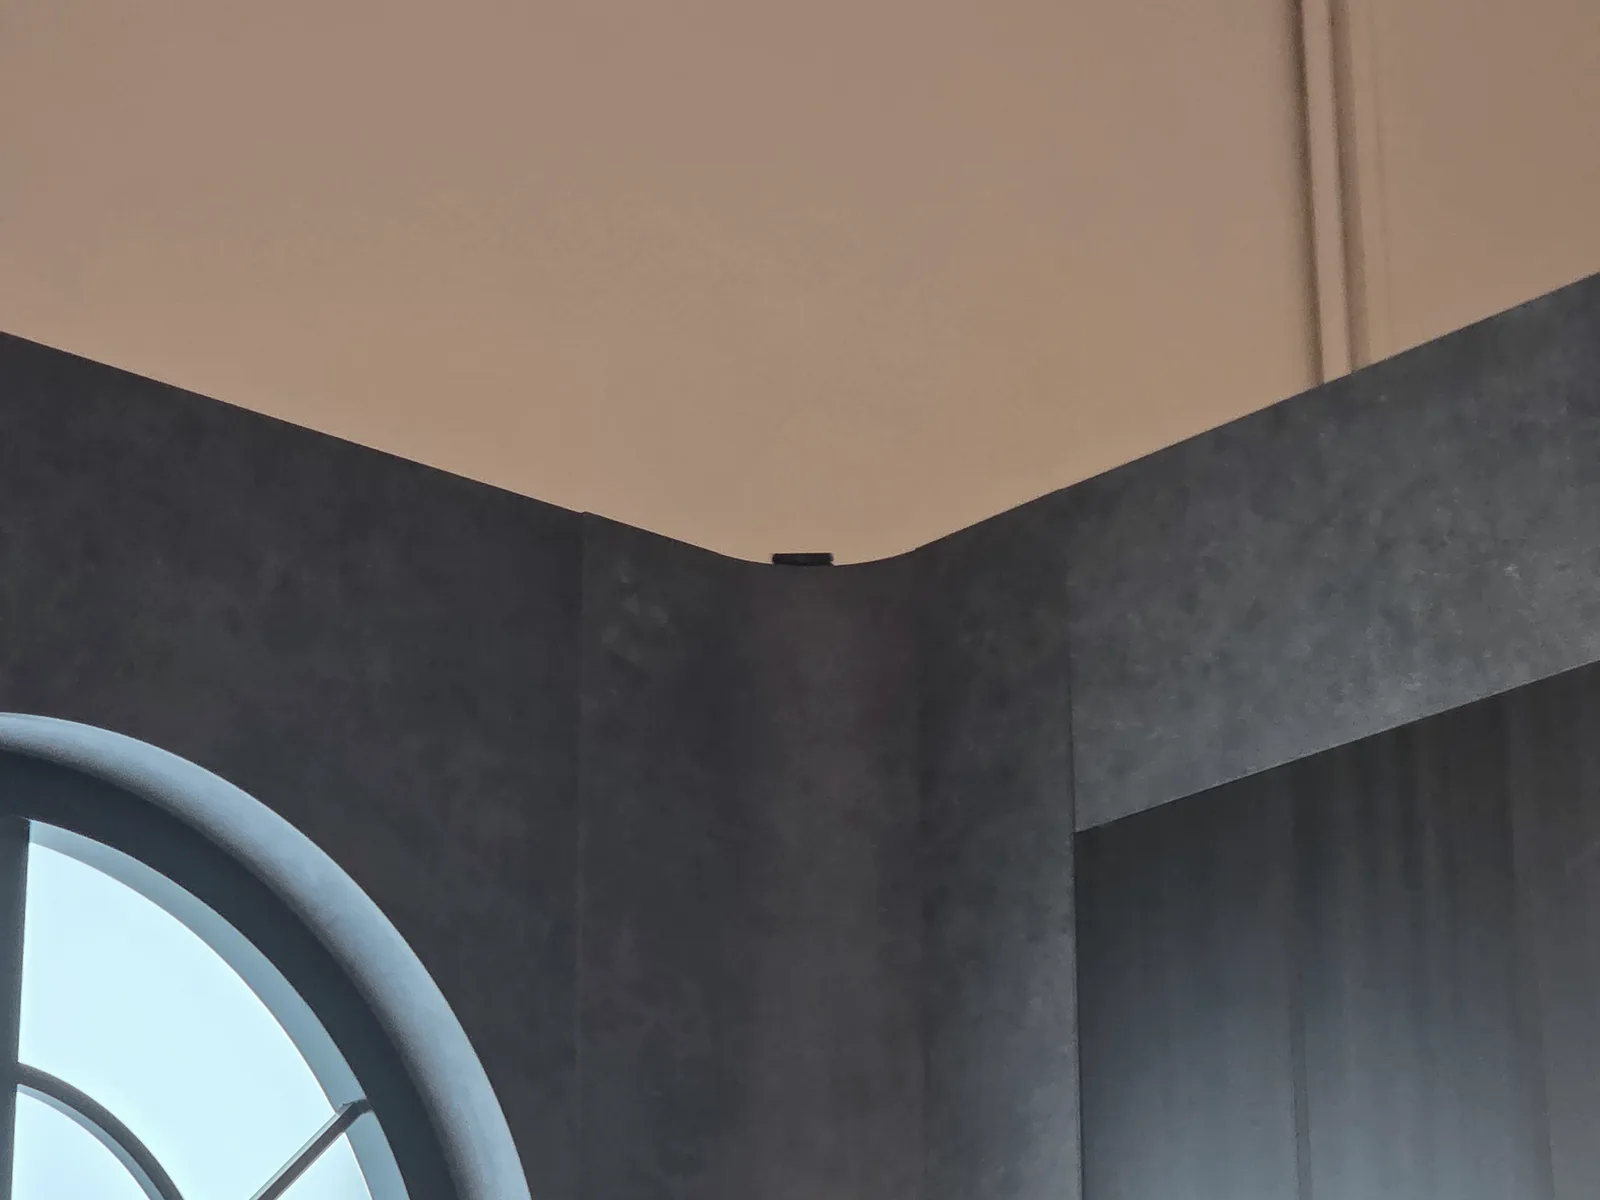
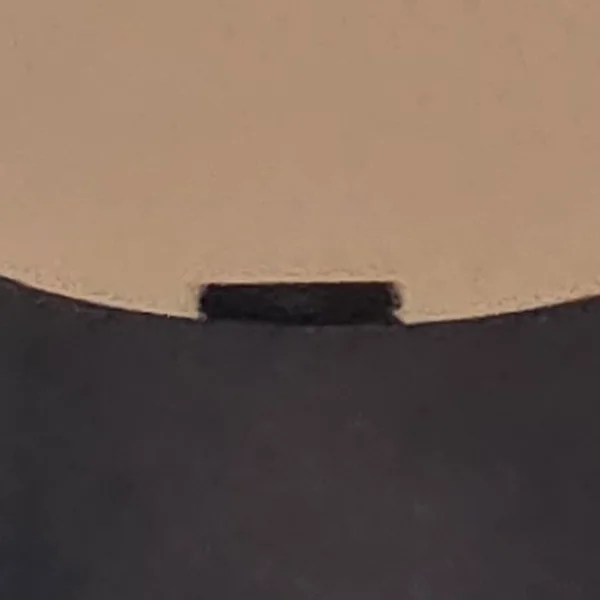
Cameras sit where they stay
out of visitors' line of sight.
Not only who walked by, but who looked and who stepped closer.
Unprocessed figures, straight into your result report and your analysis.
We do not stop at listing numbers — we name the points worth changing.
- 01Placed along the booth route
Slim cameras sit where visitors never notice them.
- 02Wired to the on-site unit
The AI Box connected to the camera turns the video into data.
- 03Turned into zone numbers
Pass, glance and dwell are grouped by zone and sent to the dashboard.
Original video is processed on-site, and only the required de-identified data is transmitted.
Industries this solution mostly serves
Frequently asked
Q1Will the cameras spoil the look of the event?+
Our cameras are about the size of your index finger. Mounted beside booth structures or signage they sit below what visitors register, and the cabling is hidden inside the booth finish. Installation takes half a day and we clear out the same day the event ends.
Q2Can you use the CCTV already in the space?+
Yes. If resolution, angle, frame rate and network connection allow it, we take the existing CCTV feed as it is. CCTV angles are built for security, though, so zone-level gaze is often out of reach — we usually lead with slim cameras and mix CCTV in as support.
Q3What goes into the report?+
Pass, glance, attention and dwell by zone, delivered as Excel and CSV originals. With them come a zone dwell heatmap, hour-by-hour flow, and action items naming what to change for the next run.
Q4Can we analyse the numbers ourselves?+
The raw data arrives unprocessed, so it is yours to work with. Load it into Excel or an analysis tool and ask your own questions, or share the dashboard link with your team and lift only the sections you need for reporting.
Q5Does following a journey identify a person?+
No. A journey holds only within a single visit and ends when the person leaves. No biometric data is stored, so no journey belongs to anyone by name — what remains is how many people stayed in which zone and for how long.
Q6Does video leave the space?+
It does not. Video is processed inside the on-site unit and deleted immediately; only anonymous aggregate figures leave. We cannot view the original footage either.
Q7What is the minimum measurement period?+
Short events such as exhibitions and pop-ups start at three days. One day is possible but swings with that day's conditions, so we recommend three or more if the result has to carry a decision. Permanent stores start from one month, and we recommend a two to three month pilot if you want to compare one period against the next.
Q8What if the venue rules do not allow cameras?+
Most exhibition halls and commercial venues only require prior approval. We prepare the placement drawing and processing description to submit to the organiser. Not storing original footage is what matters most in approval, and we supply the supporting documents for it.
Q9Can we compare this event with the last one?+
Yes, if both were measured on the same basis. At the first measurement we record the zone divisions and metric definitions, then reuse the same definitions next time. The more runs accumulate, the sharper the comparison gets.
Q10How is pricing decided?+
By the size of the space, the number of zones to separate, and the measurement period. More zones to read separately means more cameras and more on-site staff. Send us a floor plan or booth size and the schedule, and we will come back with a setup and a quote.
Installations
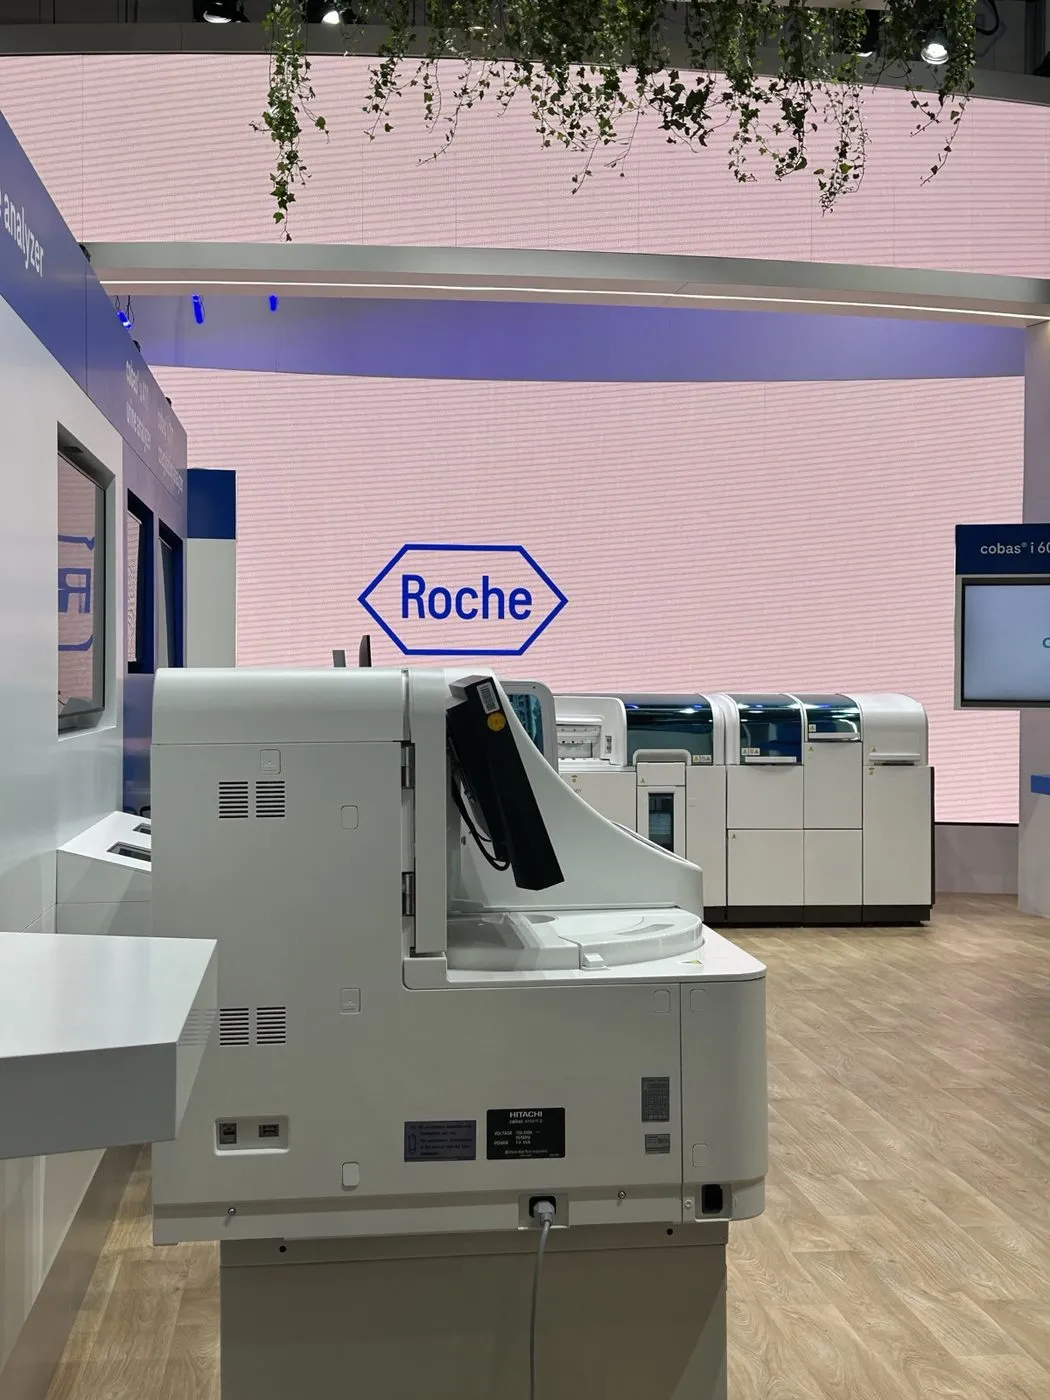
EventVision was deployed at flagship events among Roche's 300-plus exhibitions a year. Exhibition data utilization rose from 12% to 89%, and the pilot became an annual contract.
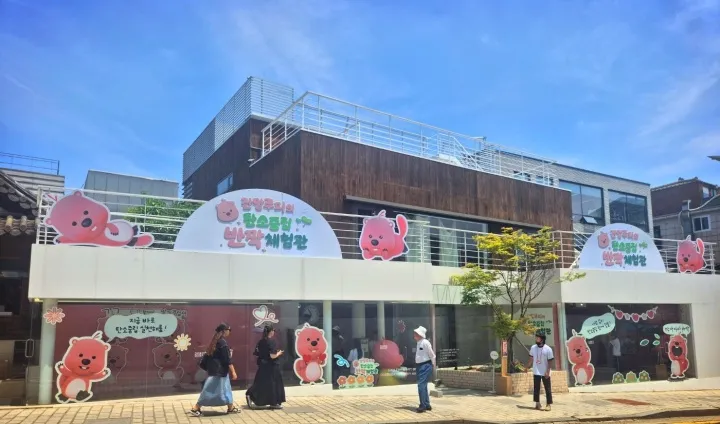
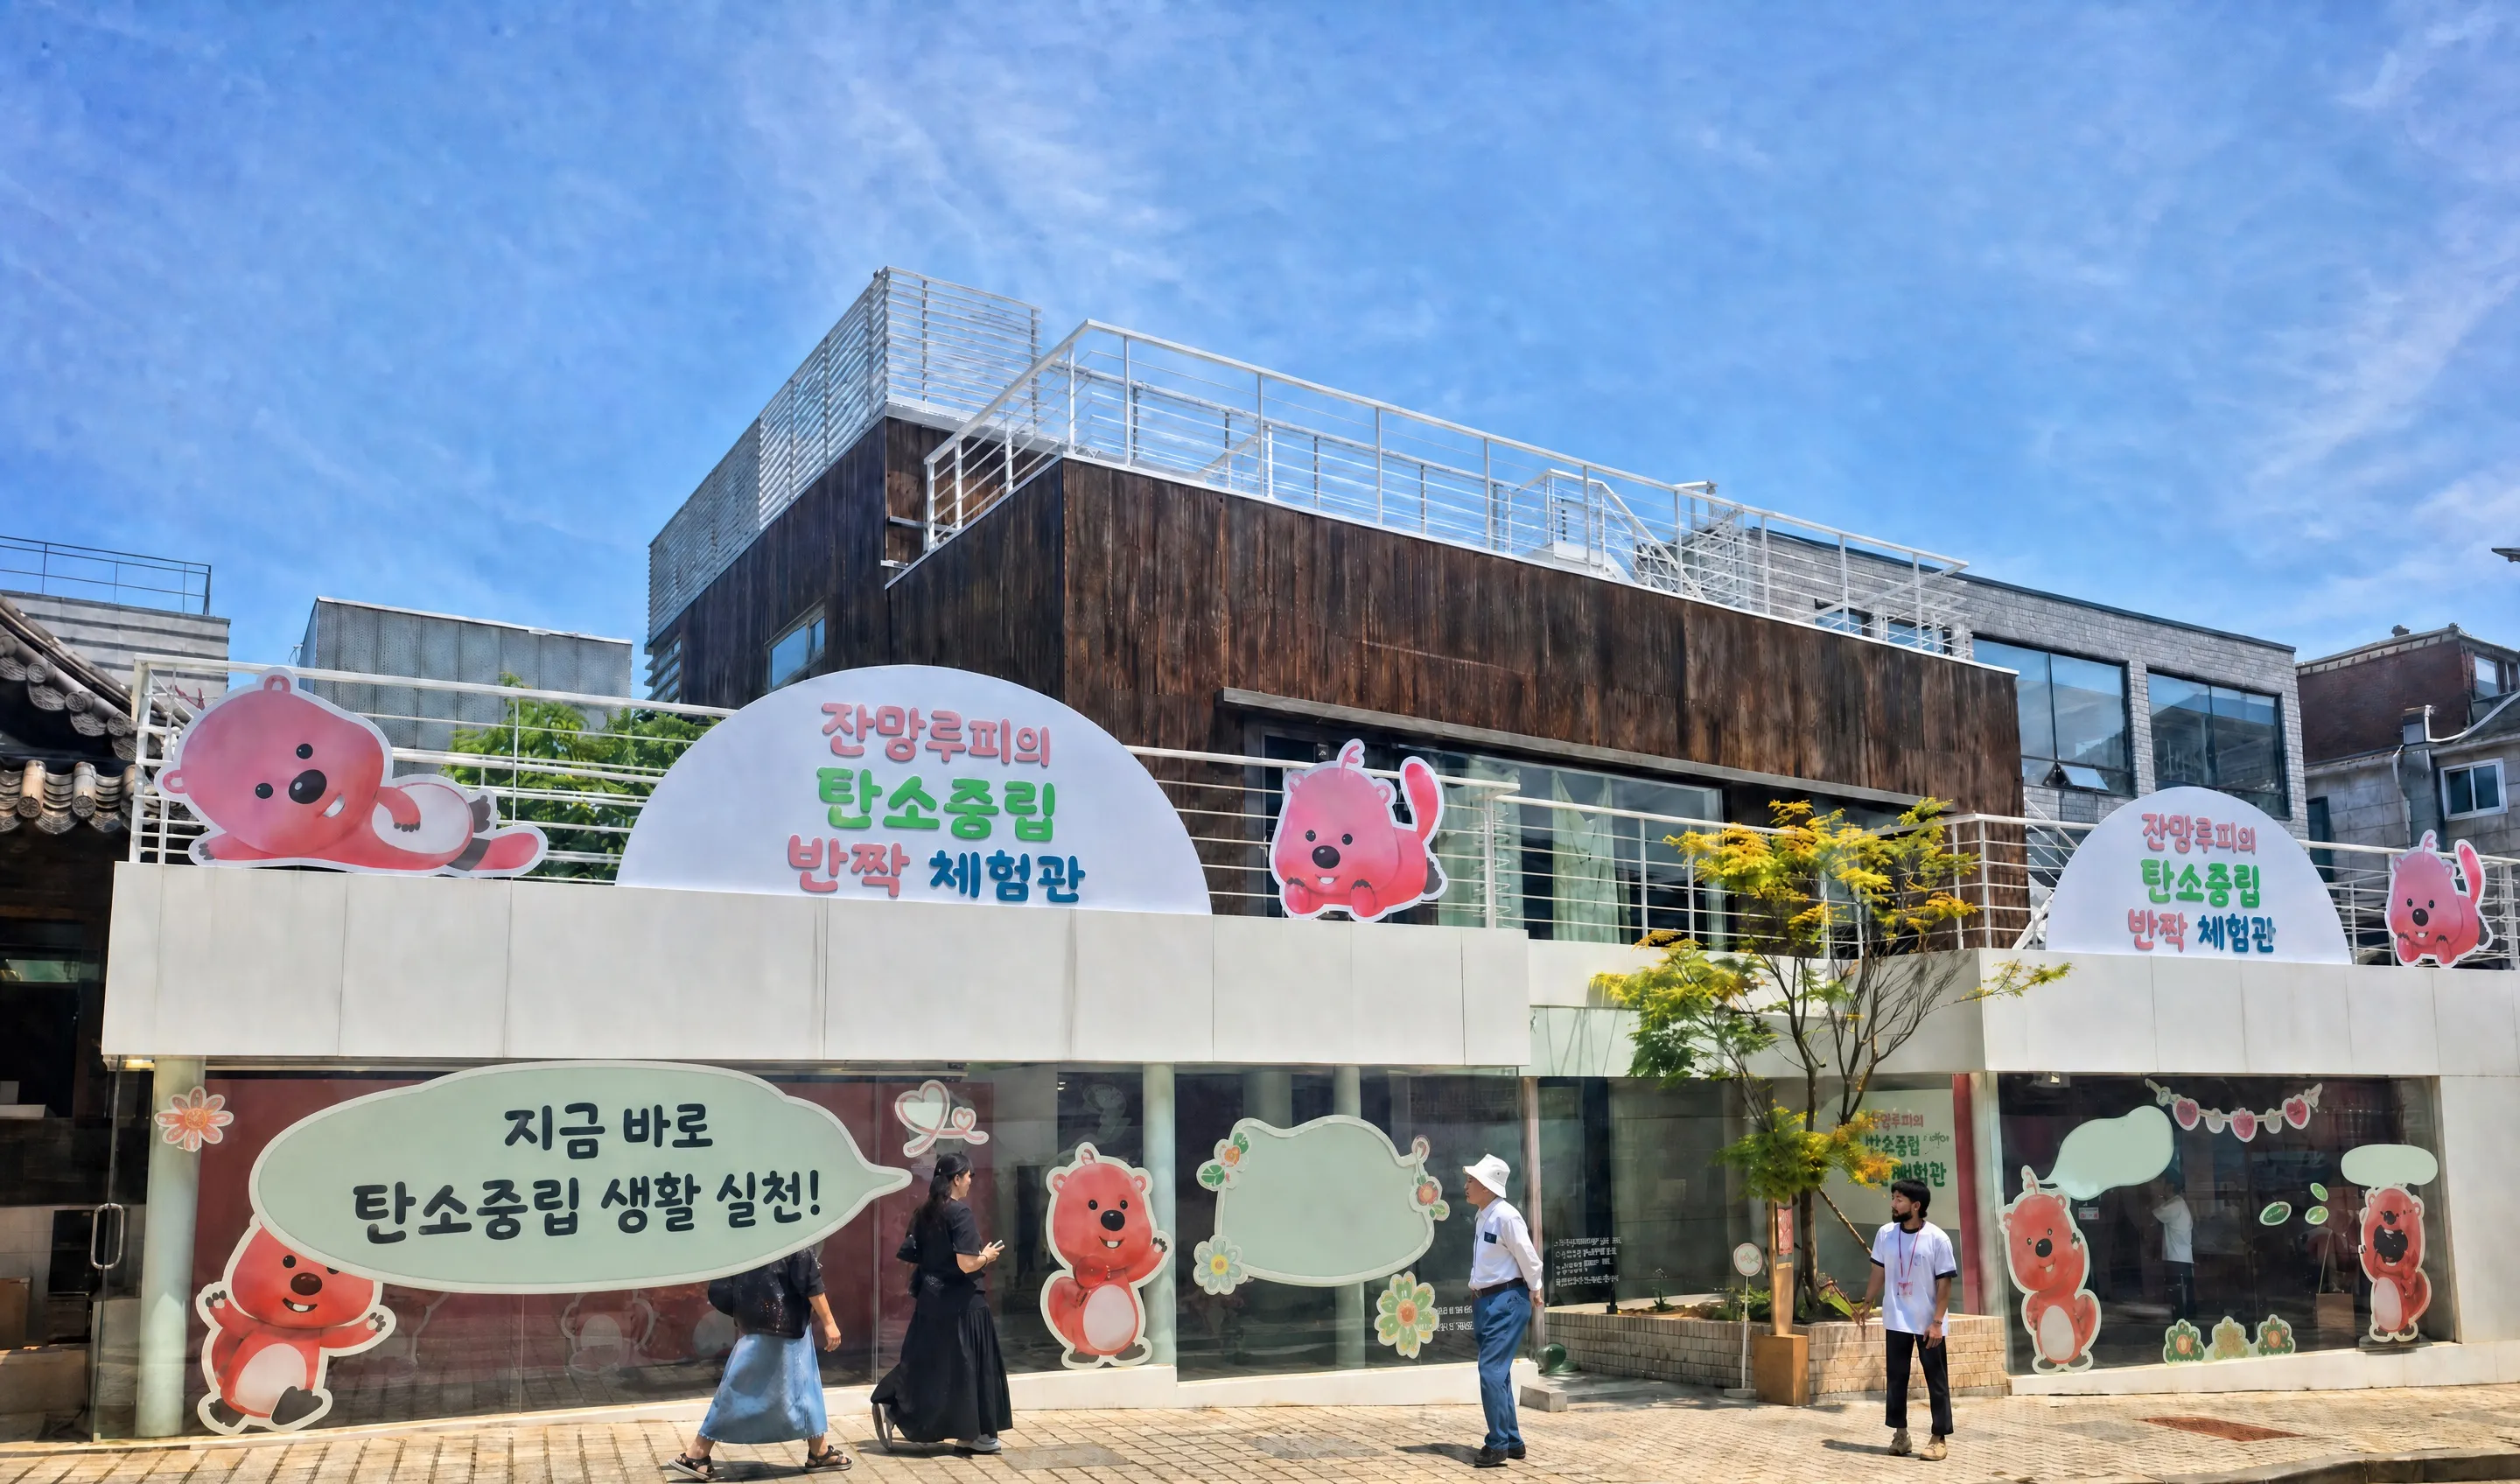
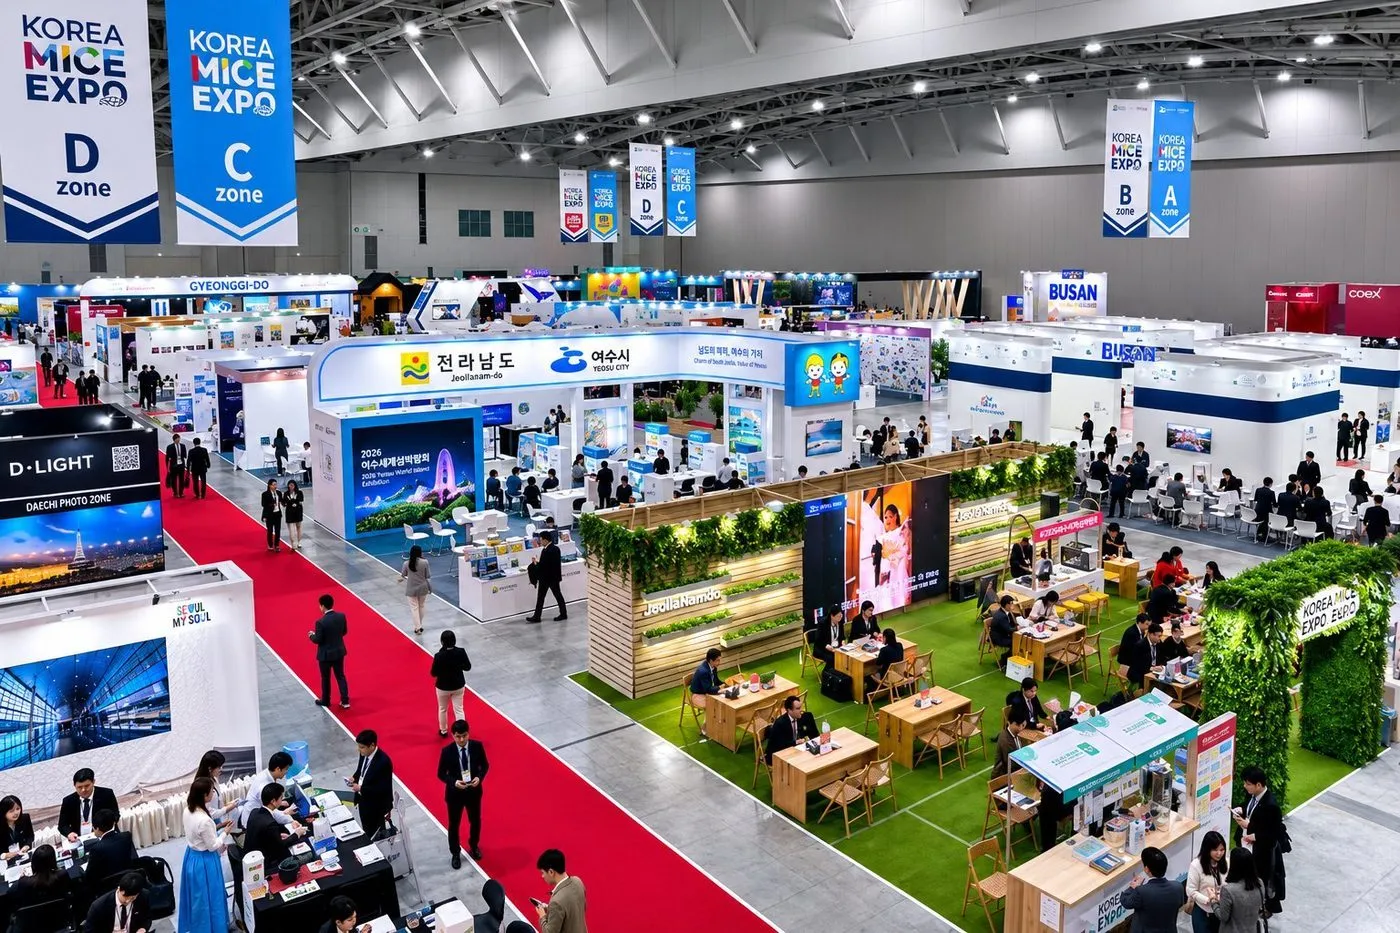
Start with this event
We first check whether your existing cameras can be used. Events start at three days, permanent stores at one month.