
The offline world,finally in focus with data
SpaceVision AI is making it happen
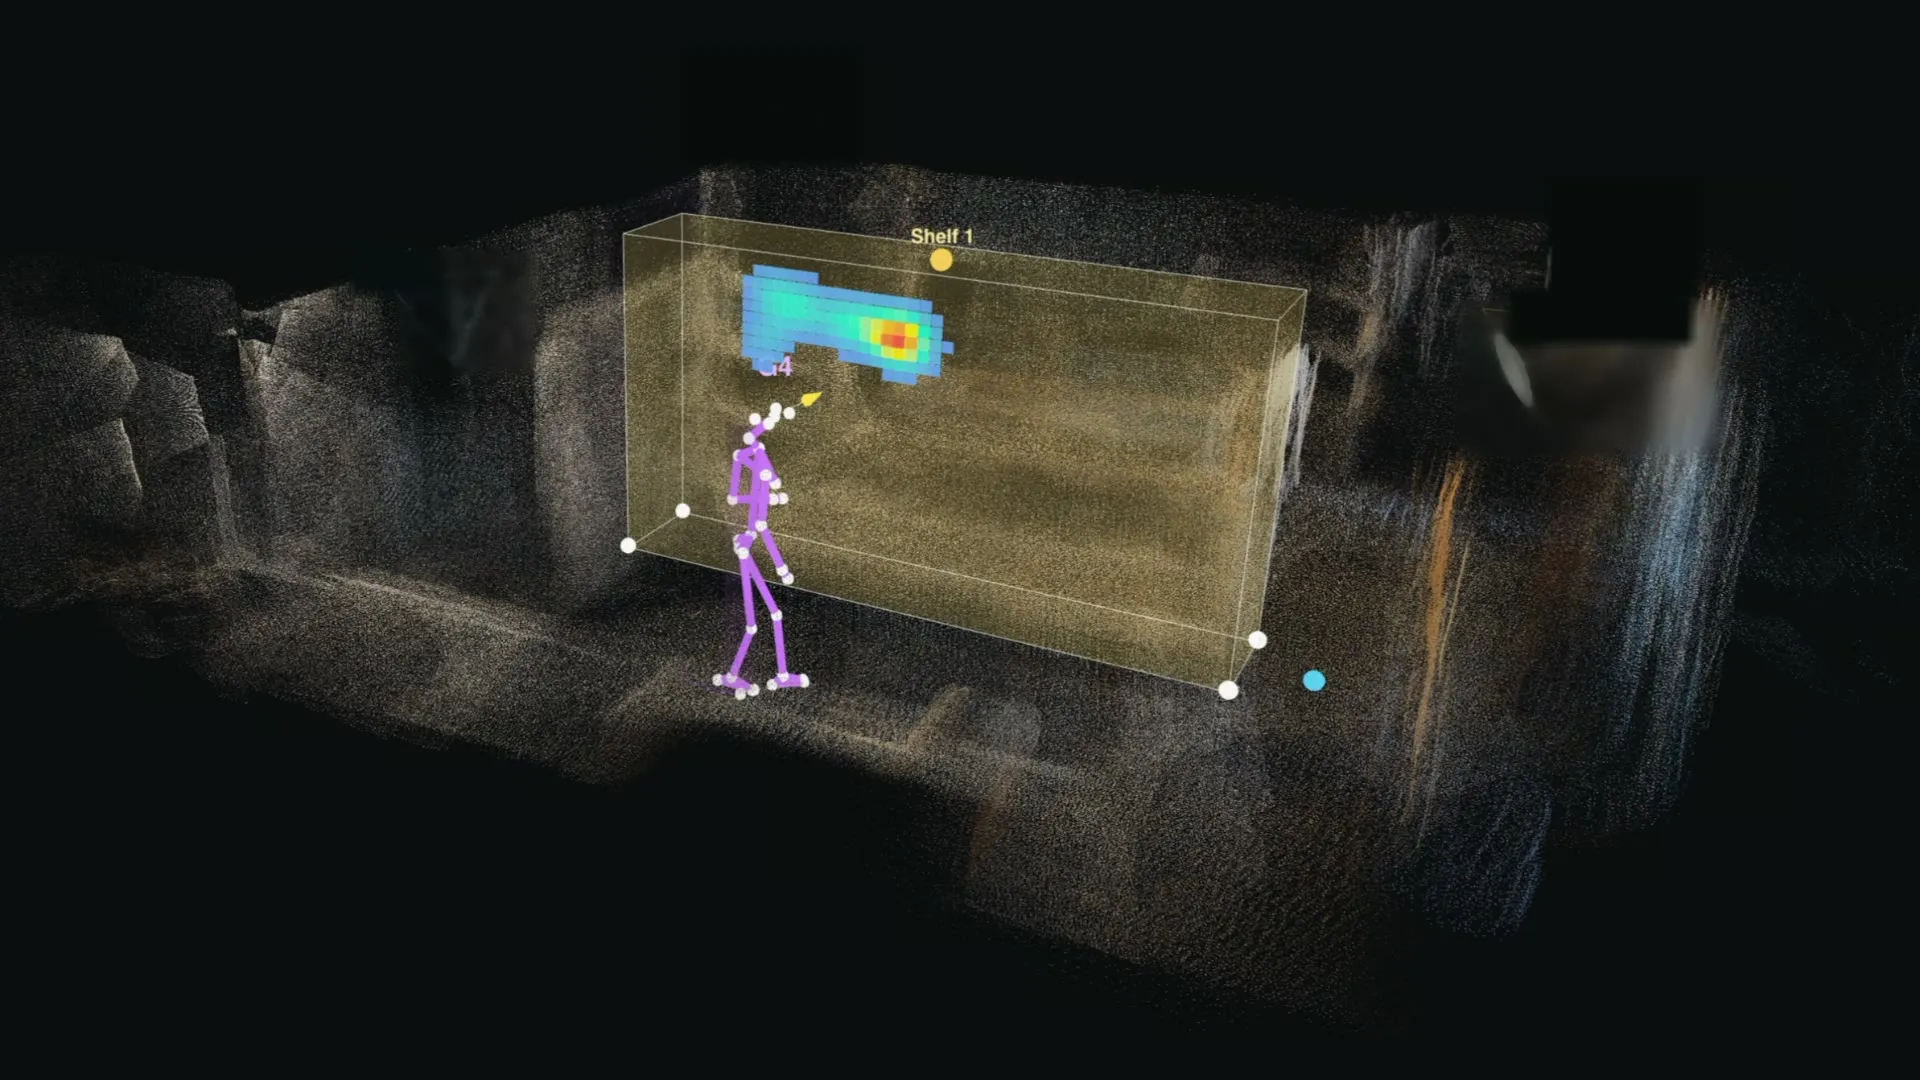
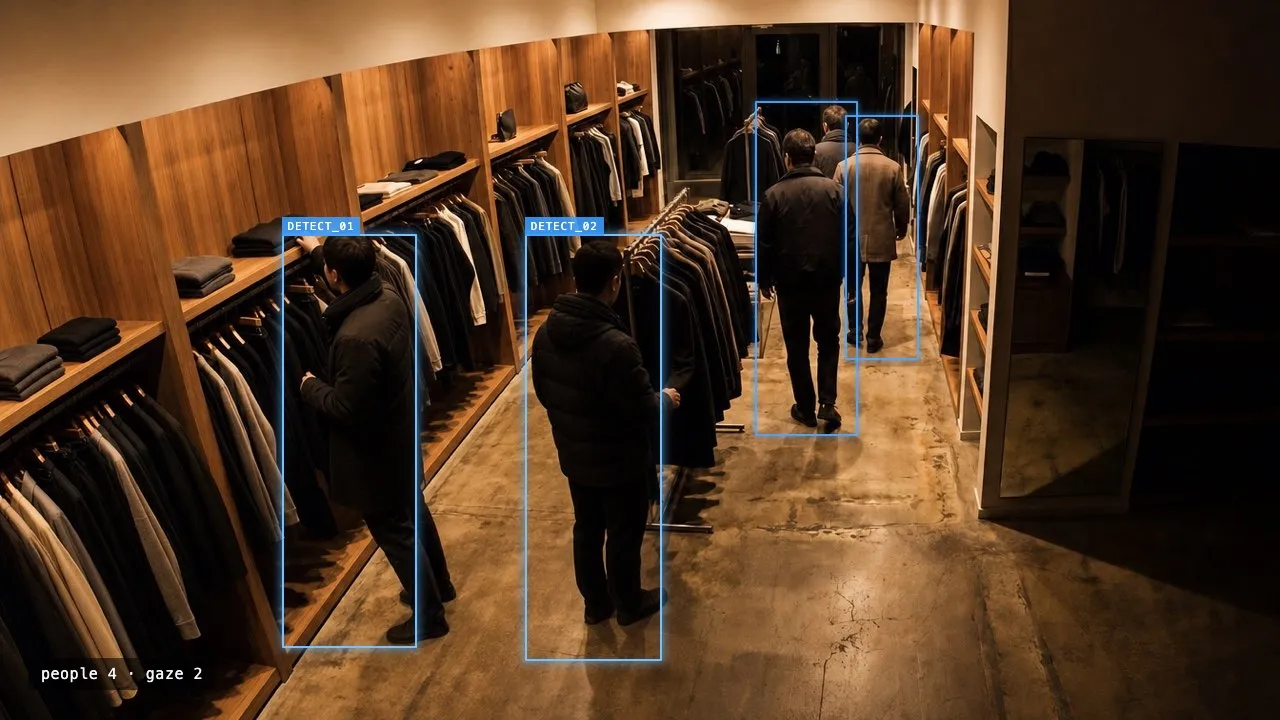
Actual demonstration footage of the system measuring in real time.
We started from one question.
Why is there no Google Analyticsfor the physical world?
Online, you can see who came in, what they looked at, and when they left.In a physical space, even how many people visited today is hard to know.
AI learned to read clicks and conversions
Now it reads gaze and dwell
What happens on a screen has been counted for decades. What happens in front of a store, a booth, or a pop-up mostly still is not.
Measure traffic, attention, journeys, and dwell to create data from what happens in physical space.
The value of measuring customer behavior, proven in the field worldwide
From major retail chains to global exhibitions.
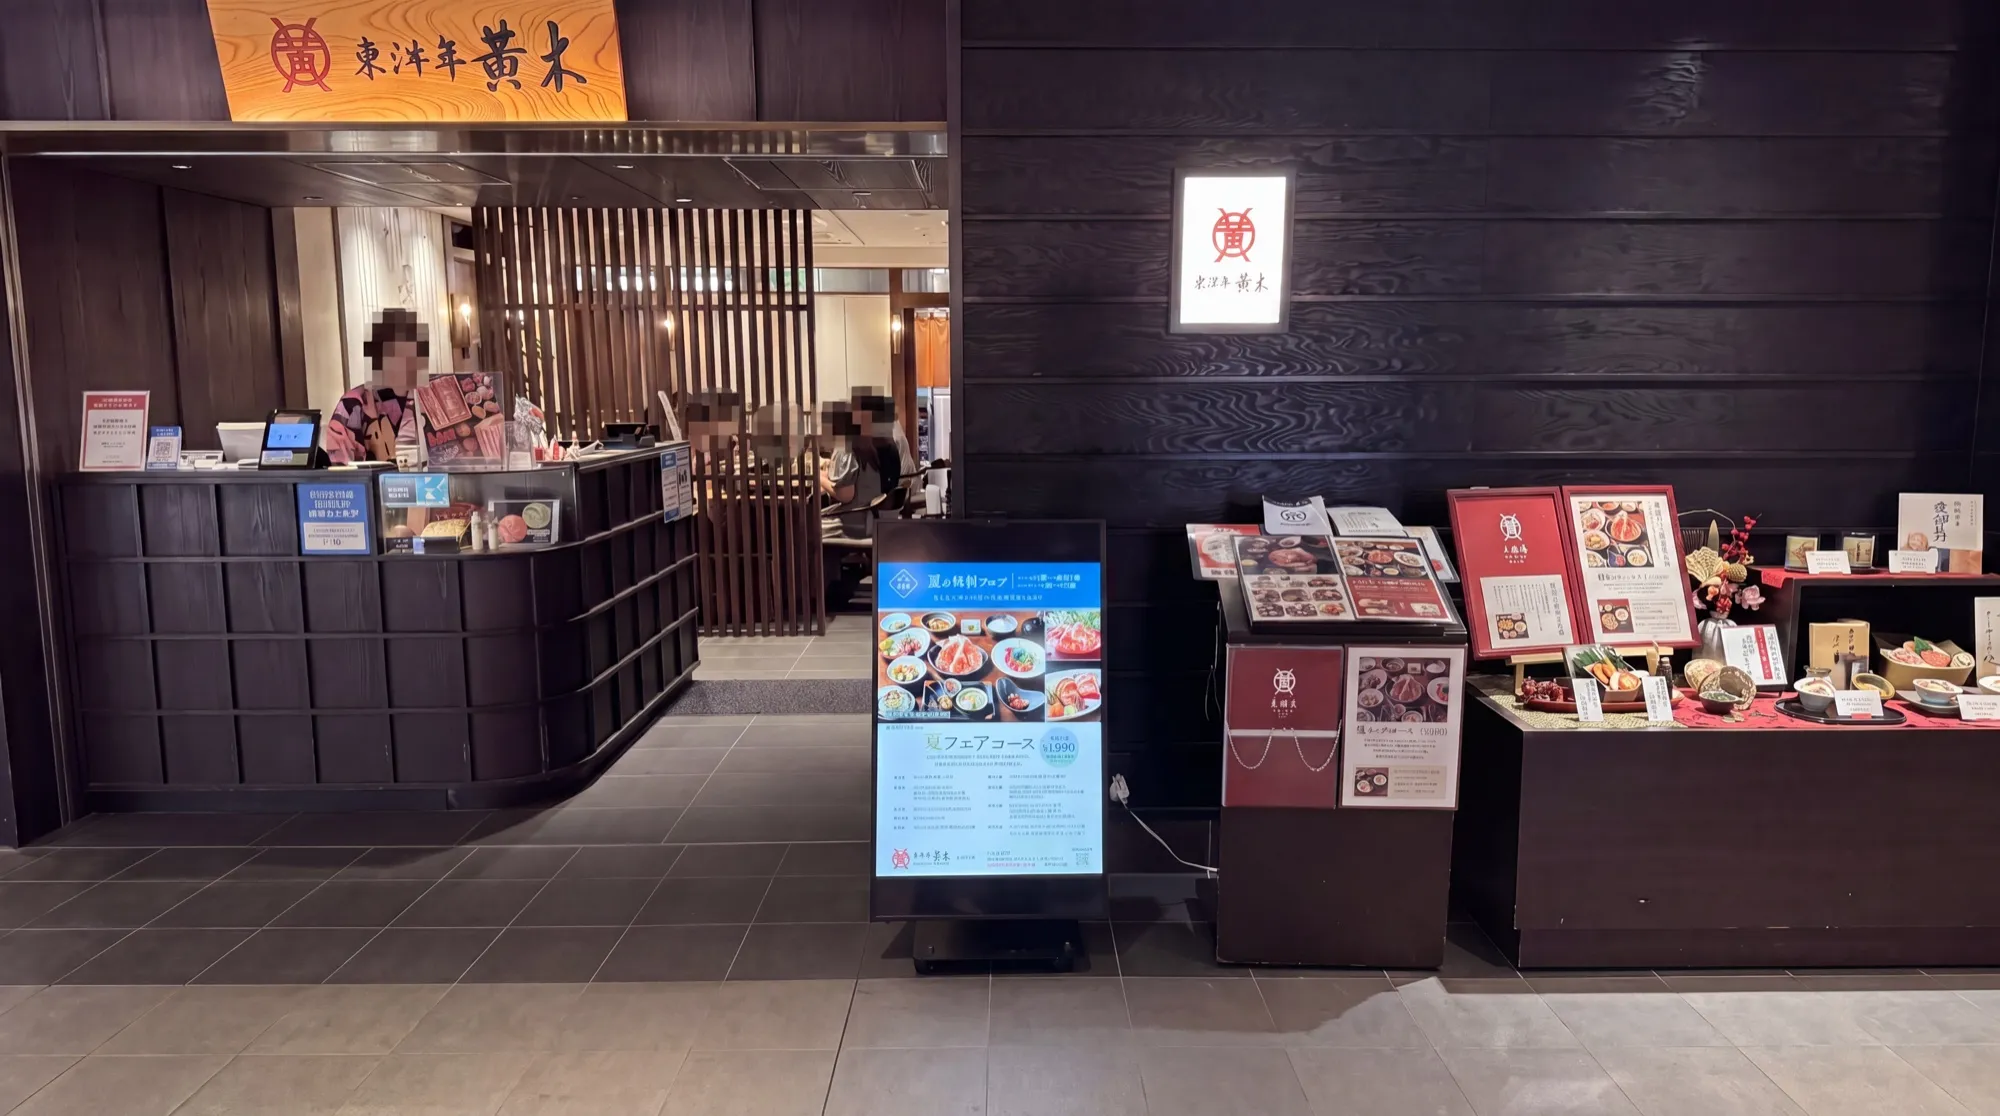 CASE_01 · O-KI STOREFRONT
Seeing which content made people stop, O-KI rebuilt the display and the content.
 CASE_02 · ROCHE GLOBAL
Using data to optimize booths and content, now in the third year of the partnership.












Customer behavior,
measured as six metrics
Which metrics you measure depends on what you need to know.
Sample data · illustrativeFour measurement solutions,
combined to fit the space
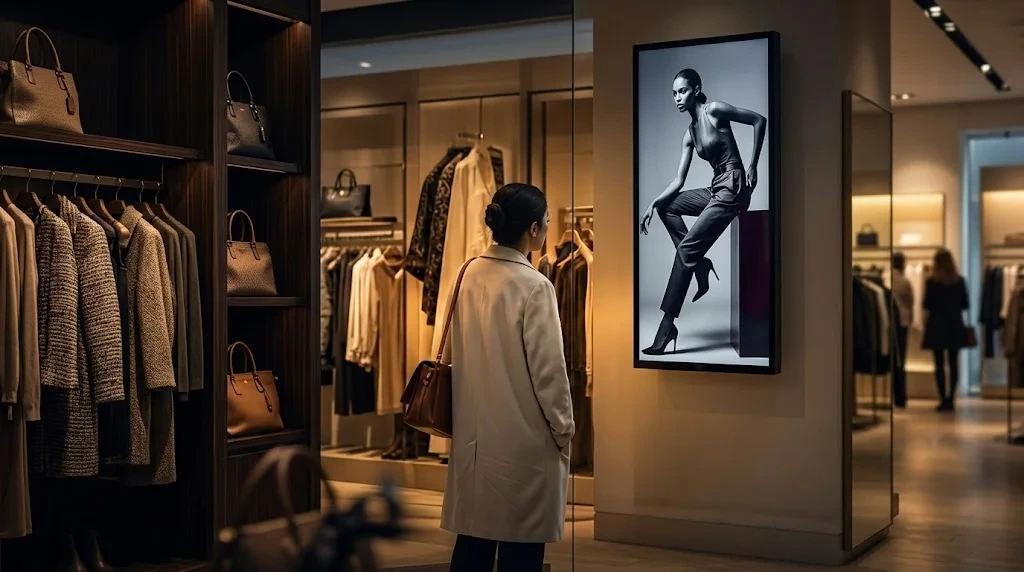
Which ad actually caught their eye?

Of everyone who walked past the store, who came in?
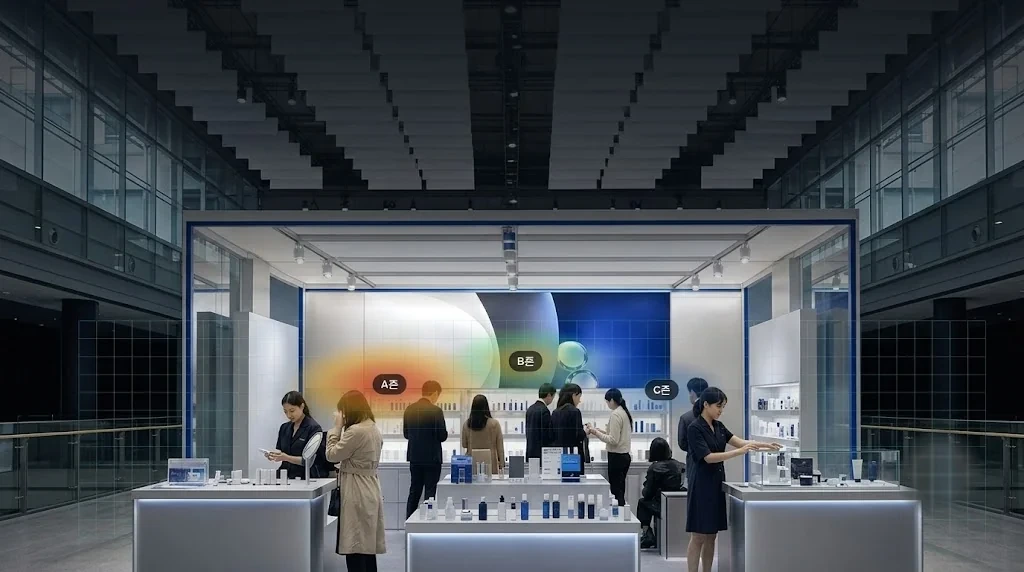
Is visitor count all your report has?
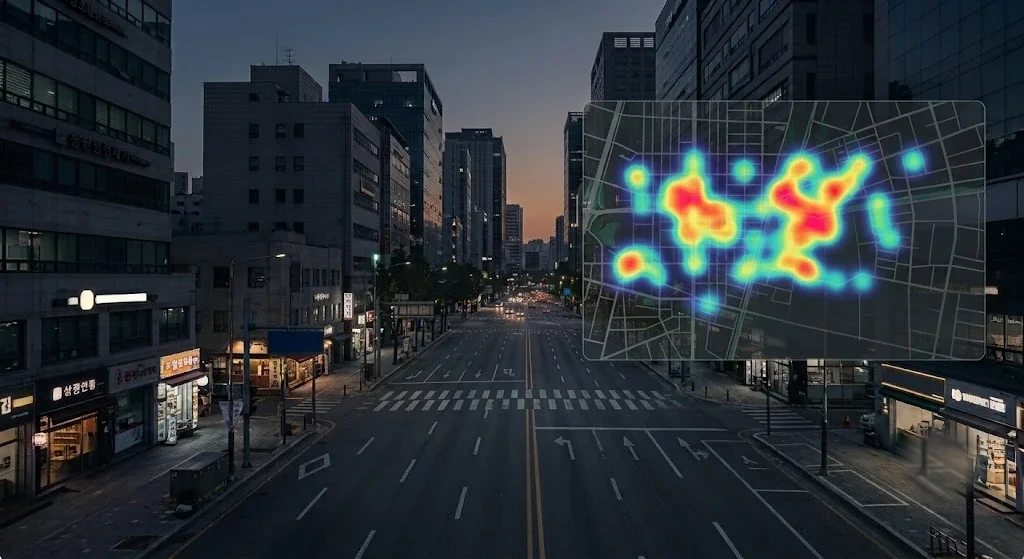
Still picking your next location on gut feel?
All four are solutions running in the field today. Measurement zones, thresholds, and report items are set to each site's purpose — the same setup is configured differently for an experience-led space and a sales-led space.
Measurement, visualized
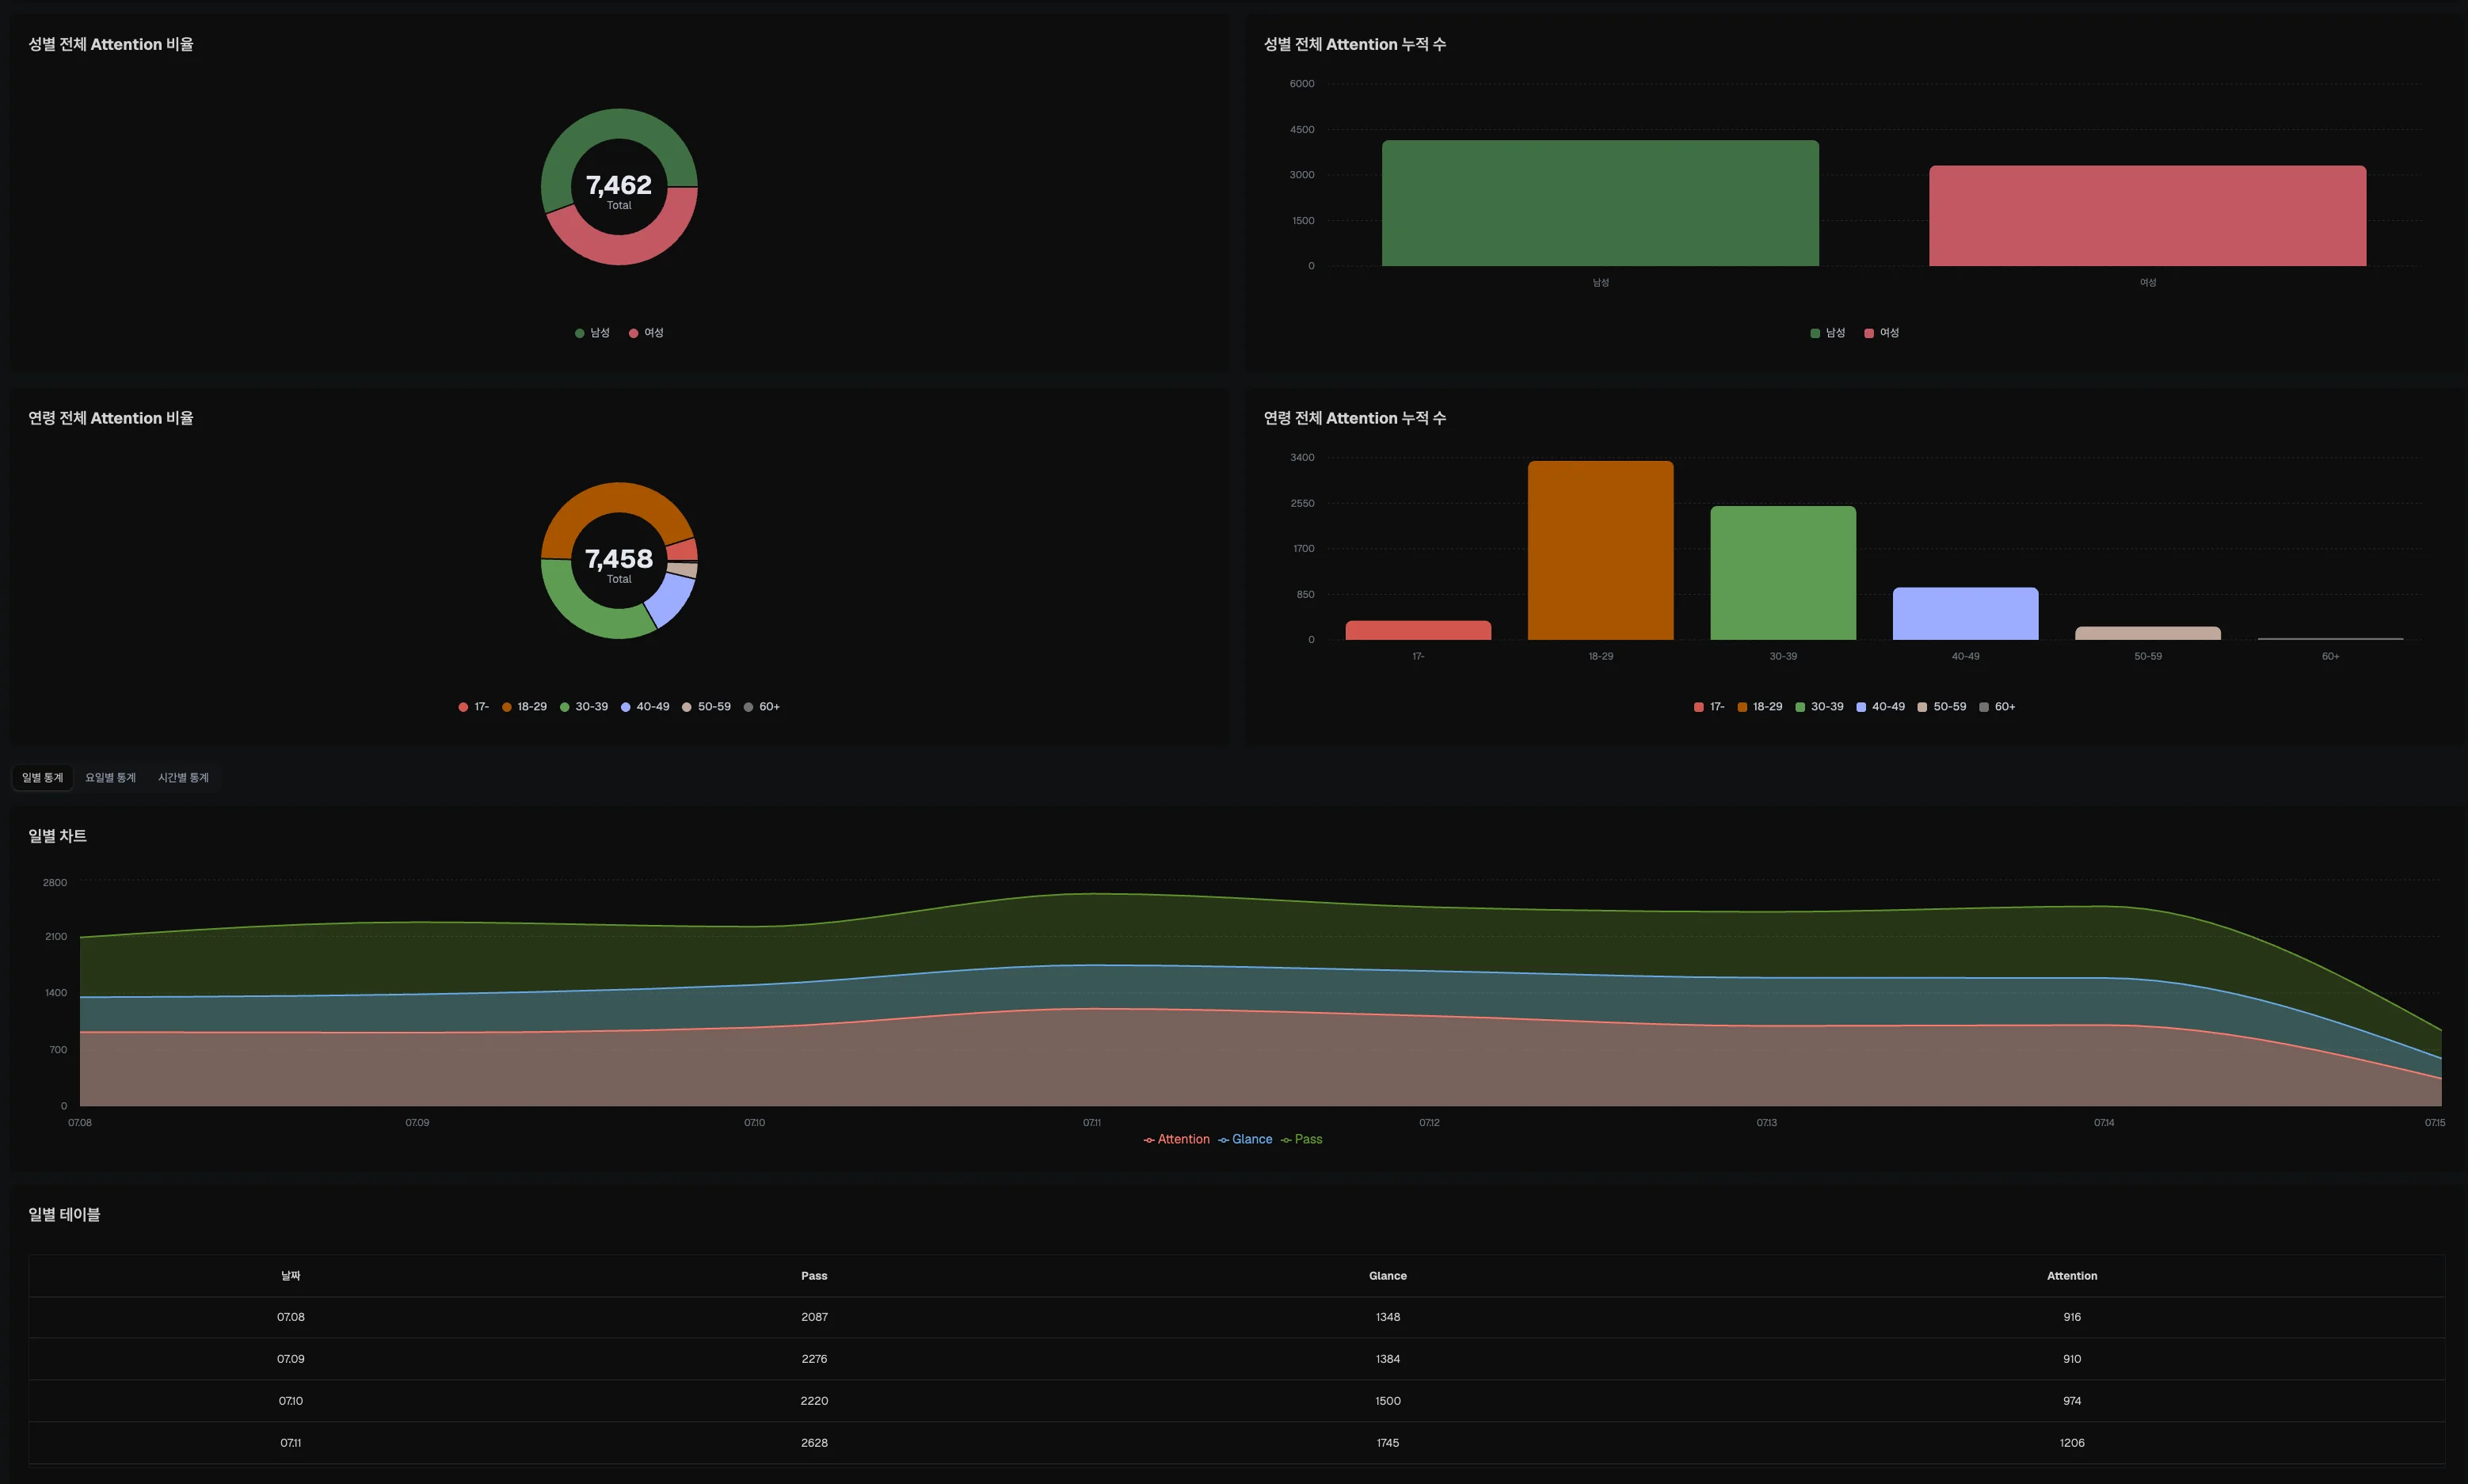
See what happened in the space on one screen, then decide what to change next.
- 3D space
- Heatmap
- Dashboard
- Female 58%
- Male 42%
| Zone | Reach | Attention | Total attn. |
|---|---|---|---|
| Beverage | 118.0K | 41.0% | 48.0K |
| Snacks | 96.0K | 36.0% | 39.0K |
| Fresh | 88.0K | 33.0% | 31.0K |
| Beauty | 54.0K | 45.0% | 27.0K |
| Household | 72.0K | 29.0% | 24.0K |
| Deli | 40.0K | 52.0% | 22.0K |
Find what makes top stores work and turn it into sales growth
- 01
Compare store performance
Compare visits, attention, entry, and dwell under the same definitions.
- 02
Find growth opportunities
See which stores and zones can generate a stronger shopper response.
- 03
Confirm performance gains
See whether changes to layouts, content, or paths improved customer behavior.
Video is processed in real time
and never stored
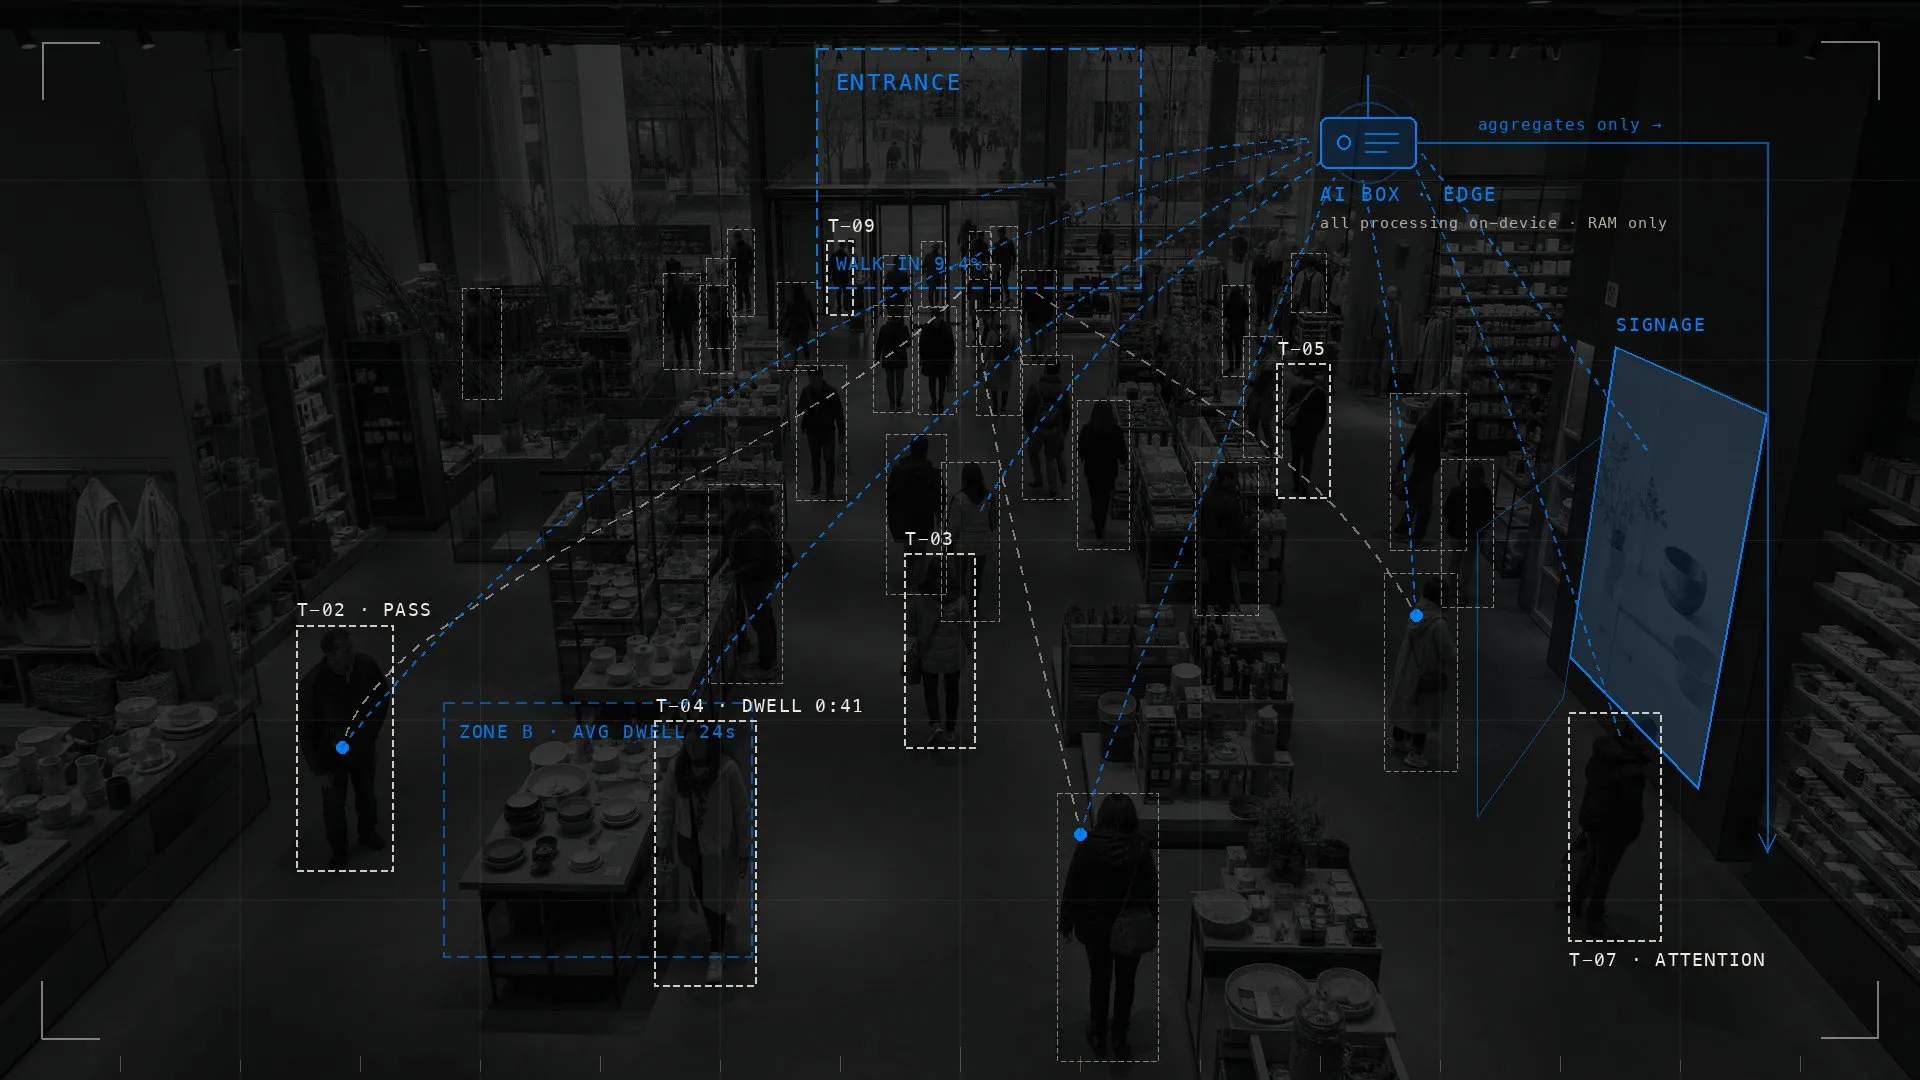
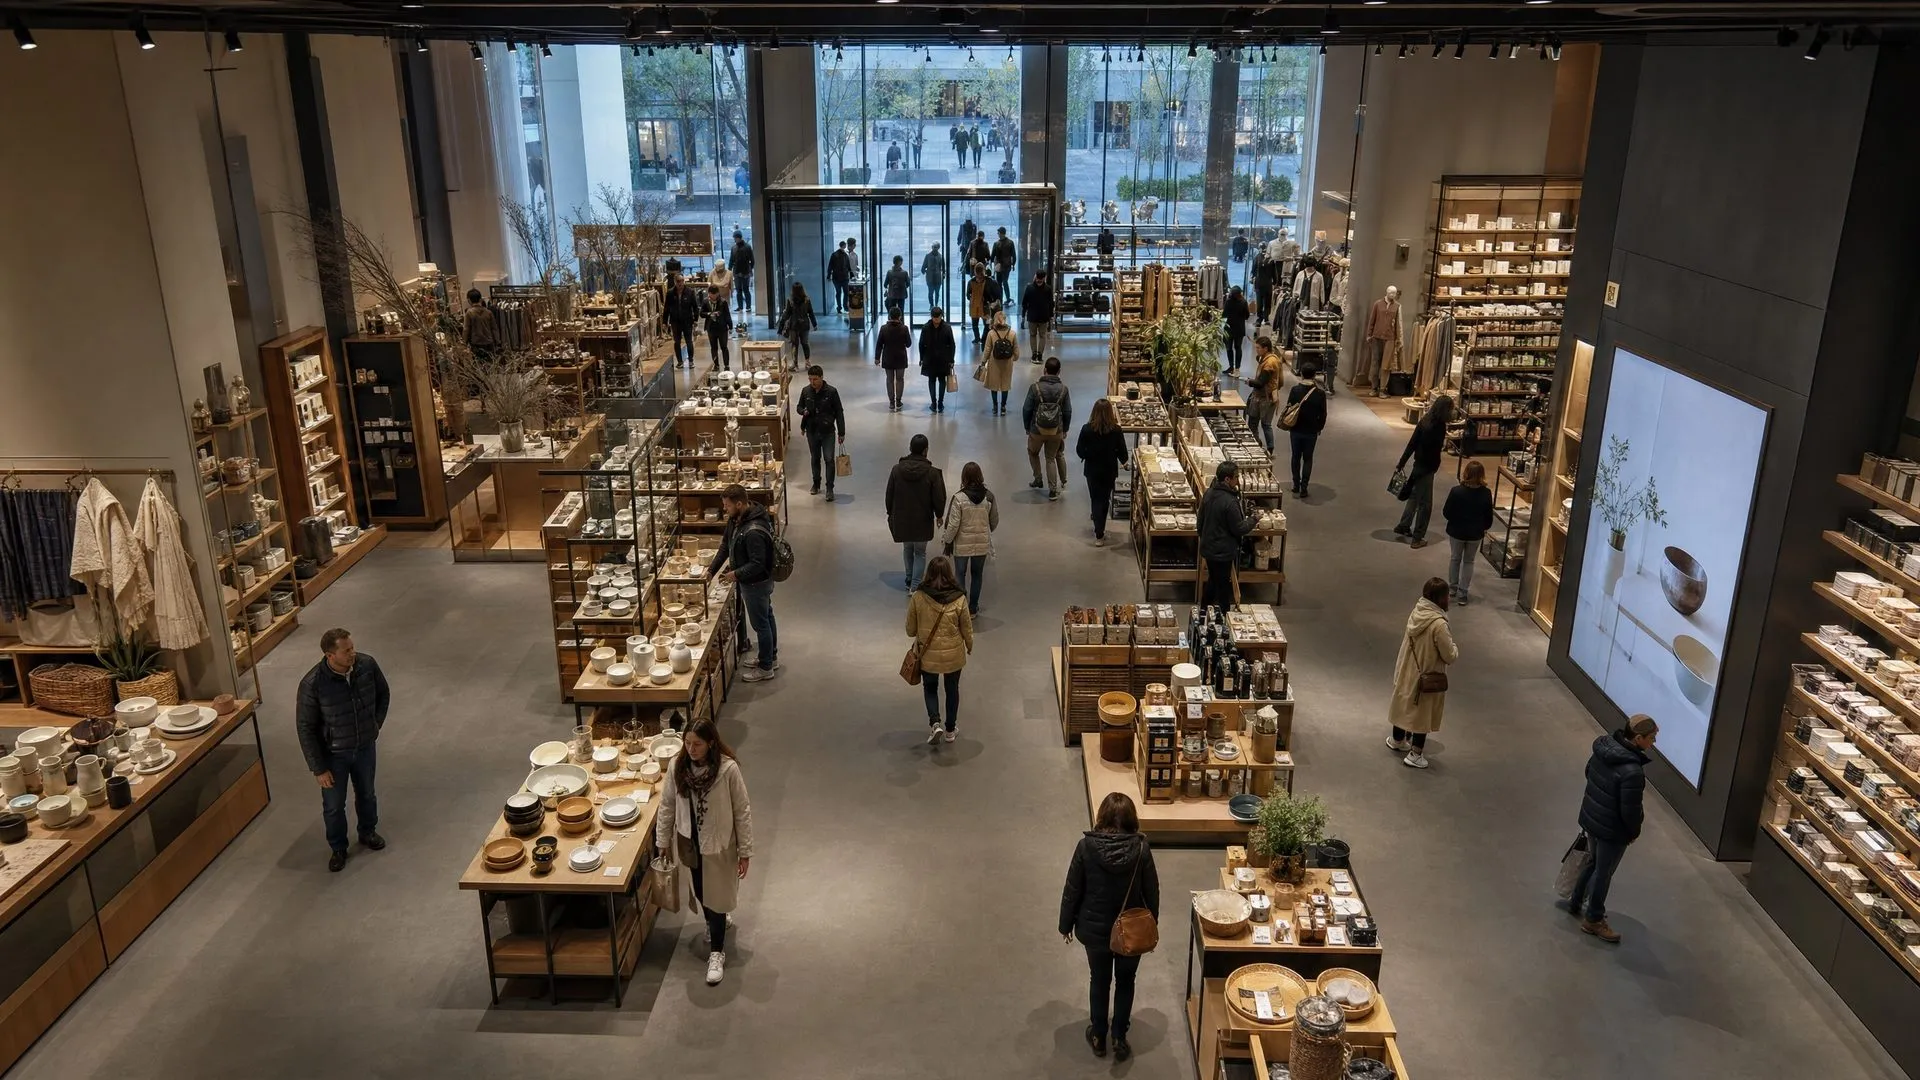
Drag the boundary to see what stays and what leaves
Raw footage is analyzed inside the on-site processing device and never stored.
Each deployment is configured to the applicable regulations and the customer's security and privacy policies.
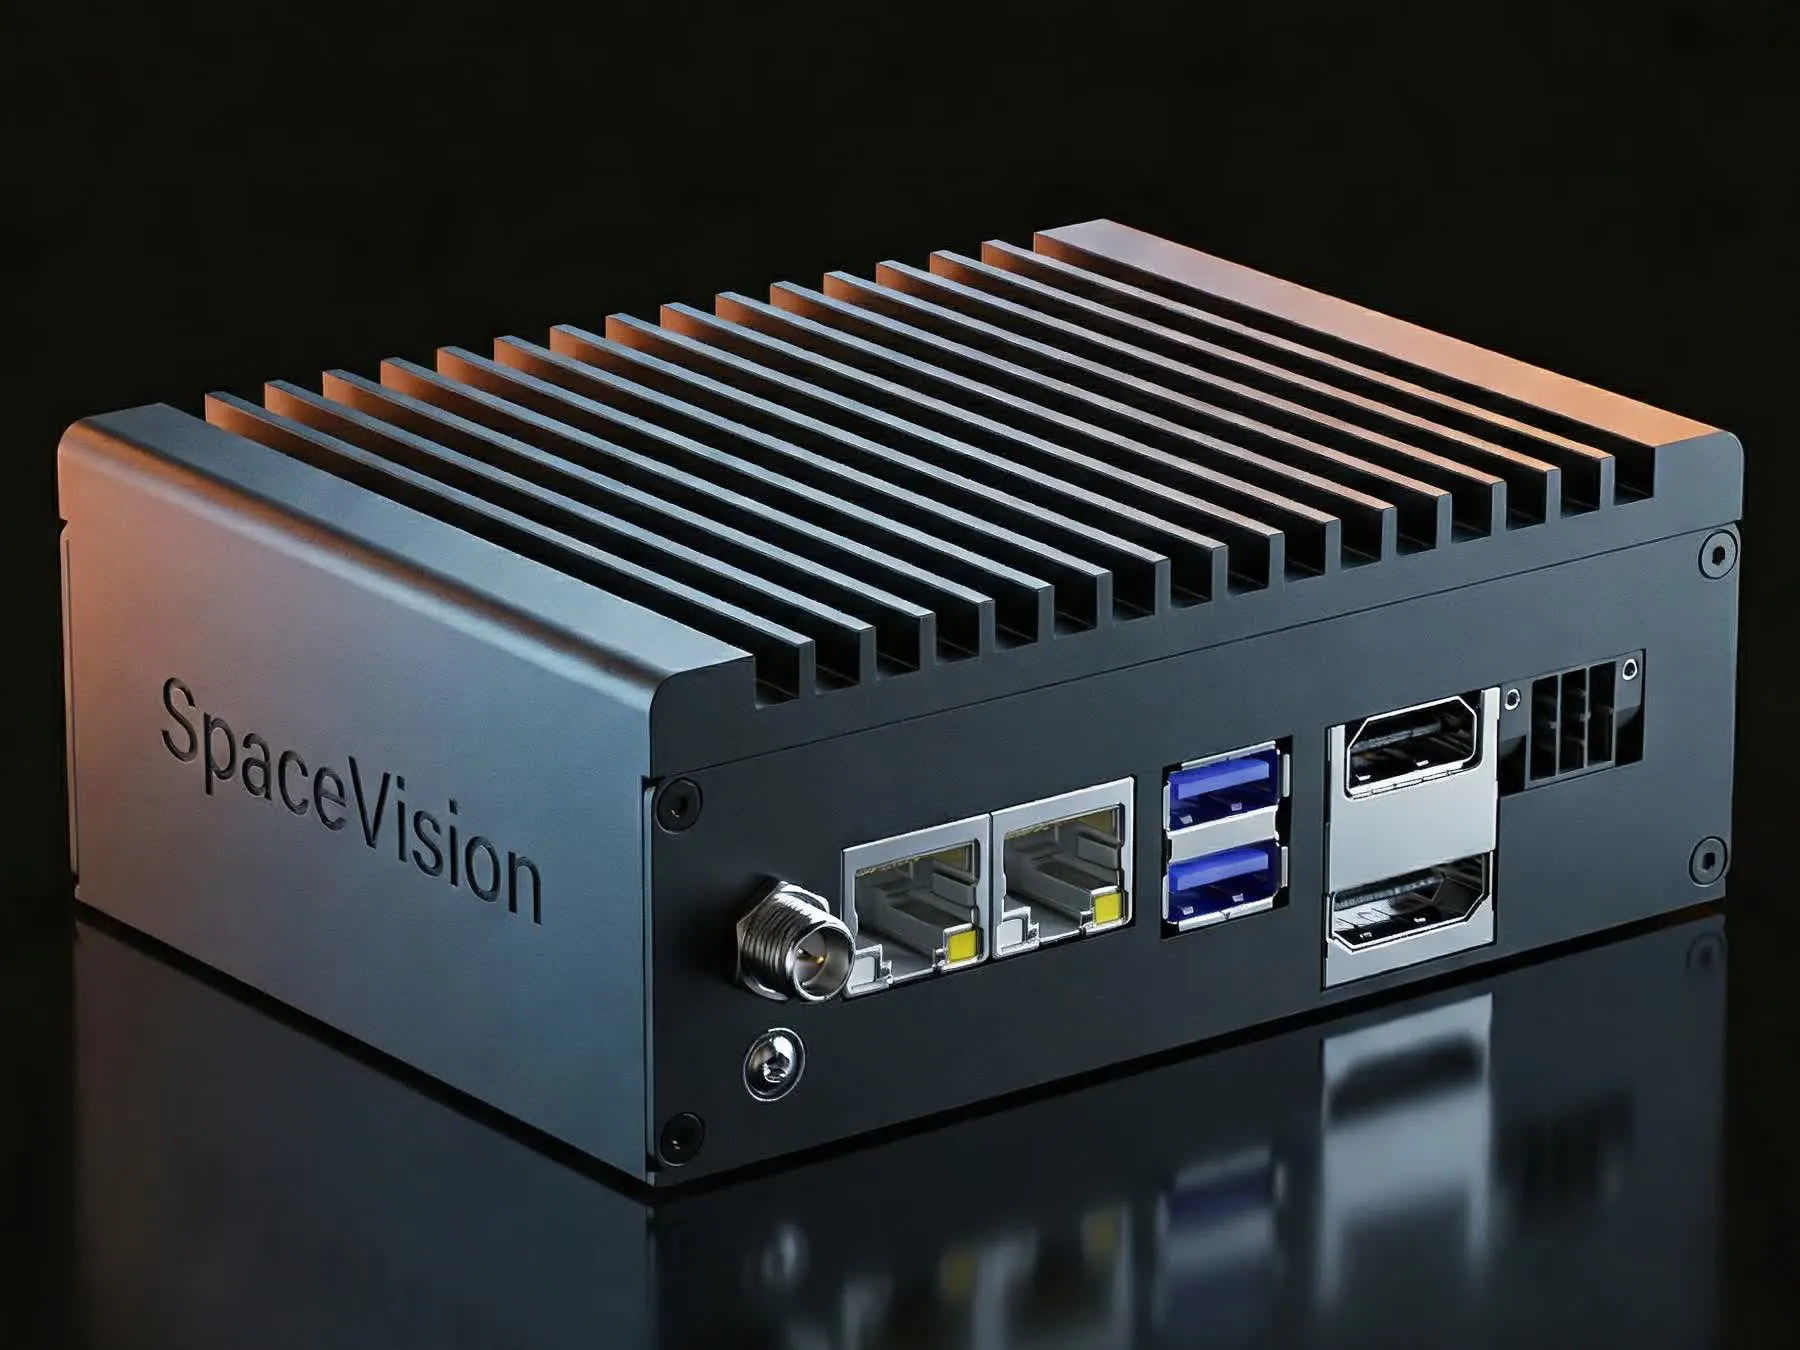
PlatformCamera footage is analyzed on a device inside the store.
De-identified data that leaves the store appears on the dashboard.
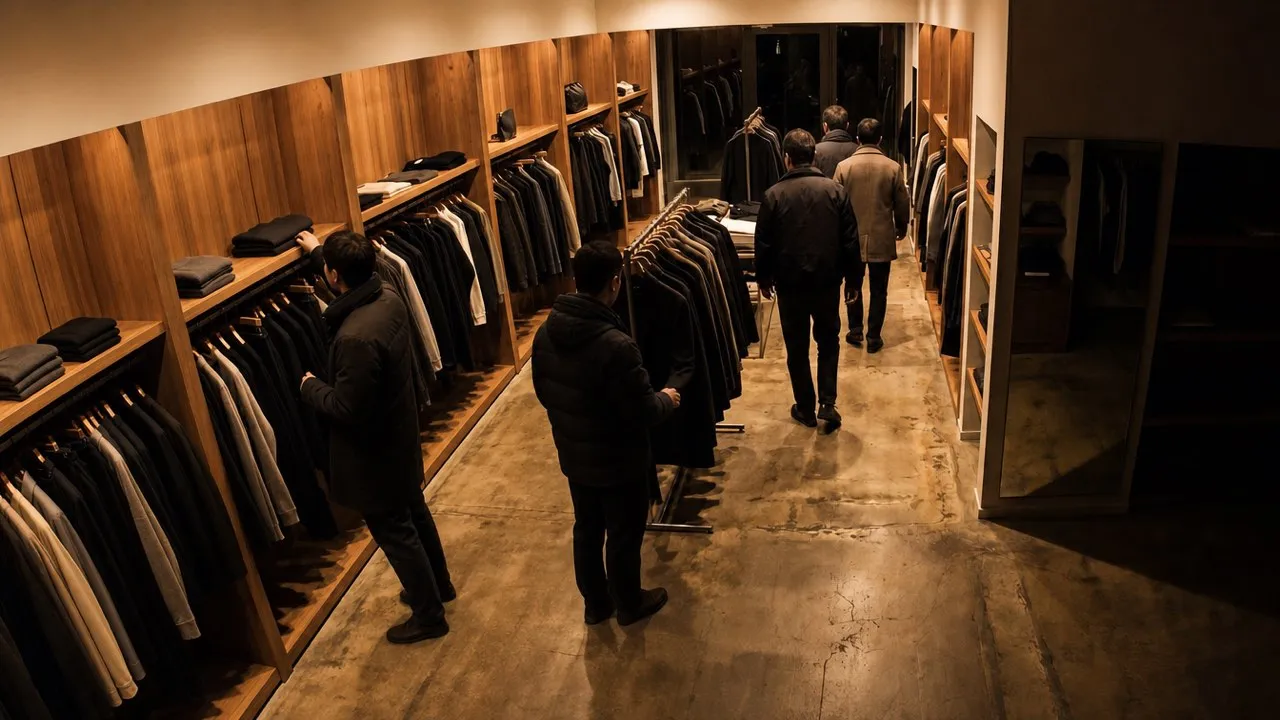
What kind of space do you run?
The metrics change with the industry. Combine the solutions to fit yours.
 USE CASE · EXHIBITION & POP-UP
FAQ
The setup, the measurement baseline and what you receive all vary by site. These are the things people ask us most.
What is the minimum measurement period?
It depends on the solution and the goal. A few-day event can be measured over a short window, while campaign-level measurement — ad performance in a permanent store, for example — needs a longer minimum. Tell us the space and what you want to learn, and we will set the right period with you.
How is pricing decided?
By three things: the size of the space, the measurement period, and the camera setup. The more zones you want to read separately, the more cameras it takes. Where we handle the installation ourselves, that work is priced in. Send us a floor plan or the size and schedule, and we will come back with a setup and a quote.
Does installation require construction work? Who removes it afterwards?
No construction is needed. Nothing is drilled into walls and no new cabling is run — cameras are mounted and connected to power and network. Who installs and removes depends on the site. Sometimes we go out ourselves; sometimes a partner or your own team handles it. Either way you get a full installation and operating manual, plus remote support.
What form do the results come in?
Through the dashboard. You can open the data in real time as it accumulates, view statistics broken down by period, zone and metric, and export CSV files to work into your own reporting formats. If you would like a separately produced report, we can prepare one as an add-on.
Can we take the data with us?
Aggregated metrics can be exported as CSV, and if you need regular delivery into your BI stack we will agree on an integration. You can also join the data with POS, campaign and store-operations records to compare how the measured metrics shifted before and after. Raw video never leaves the site, so it is not part of what we provide.
We are not sure how to read the numbers.
As the measurement wraps up, we walk you through what the baseline is for that space and which values stand out. On request we also write up the reading behind the numbers, so it can feed into your decisions.
Do we need visitor consent to film?
Consent is not automatically required. Because no one is identified and only aggregate numbers are kept, on-site notice is enough at most locations. Requirements can still differ by venue rules or your own policy, so we prepare the on-site notice wording and the documents your team needs for review. If you need returning visitors distinguished within a set time window, we work through the notice and consent scope for that case together at the start.
How accurate is it?
Around 96% for gender and 94% for age band. Accuracy varies with distance, angle and lighting, so before installation we agree on which zones need which level of accuracy and place the cameras accordingly. Classification is an estimate based on appearance; nationality and ethnicity are not distinguished.