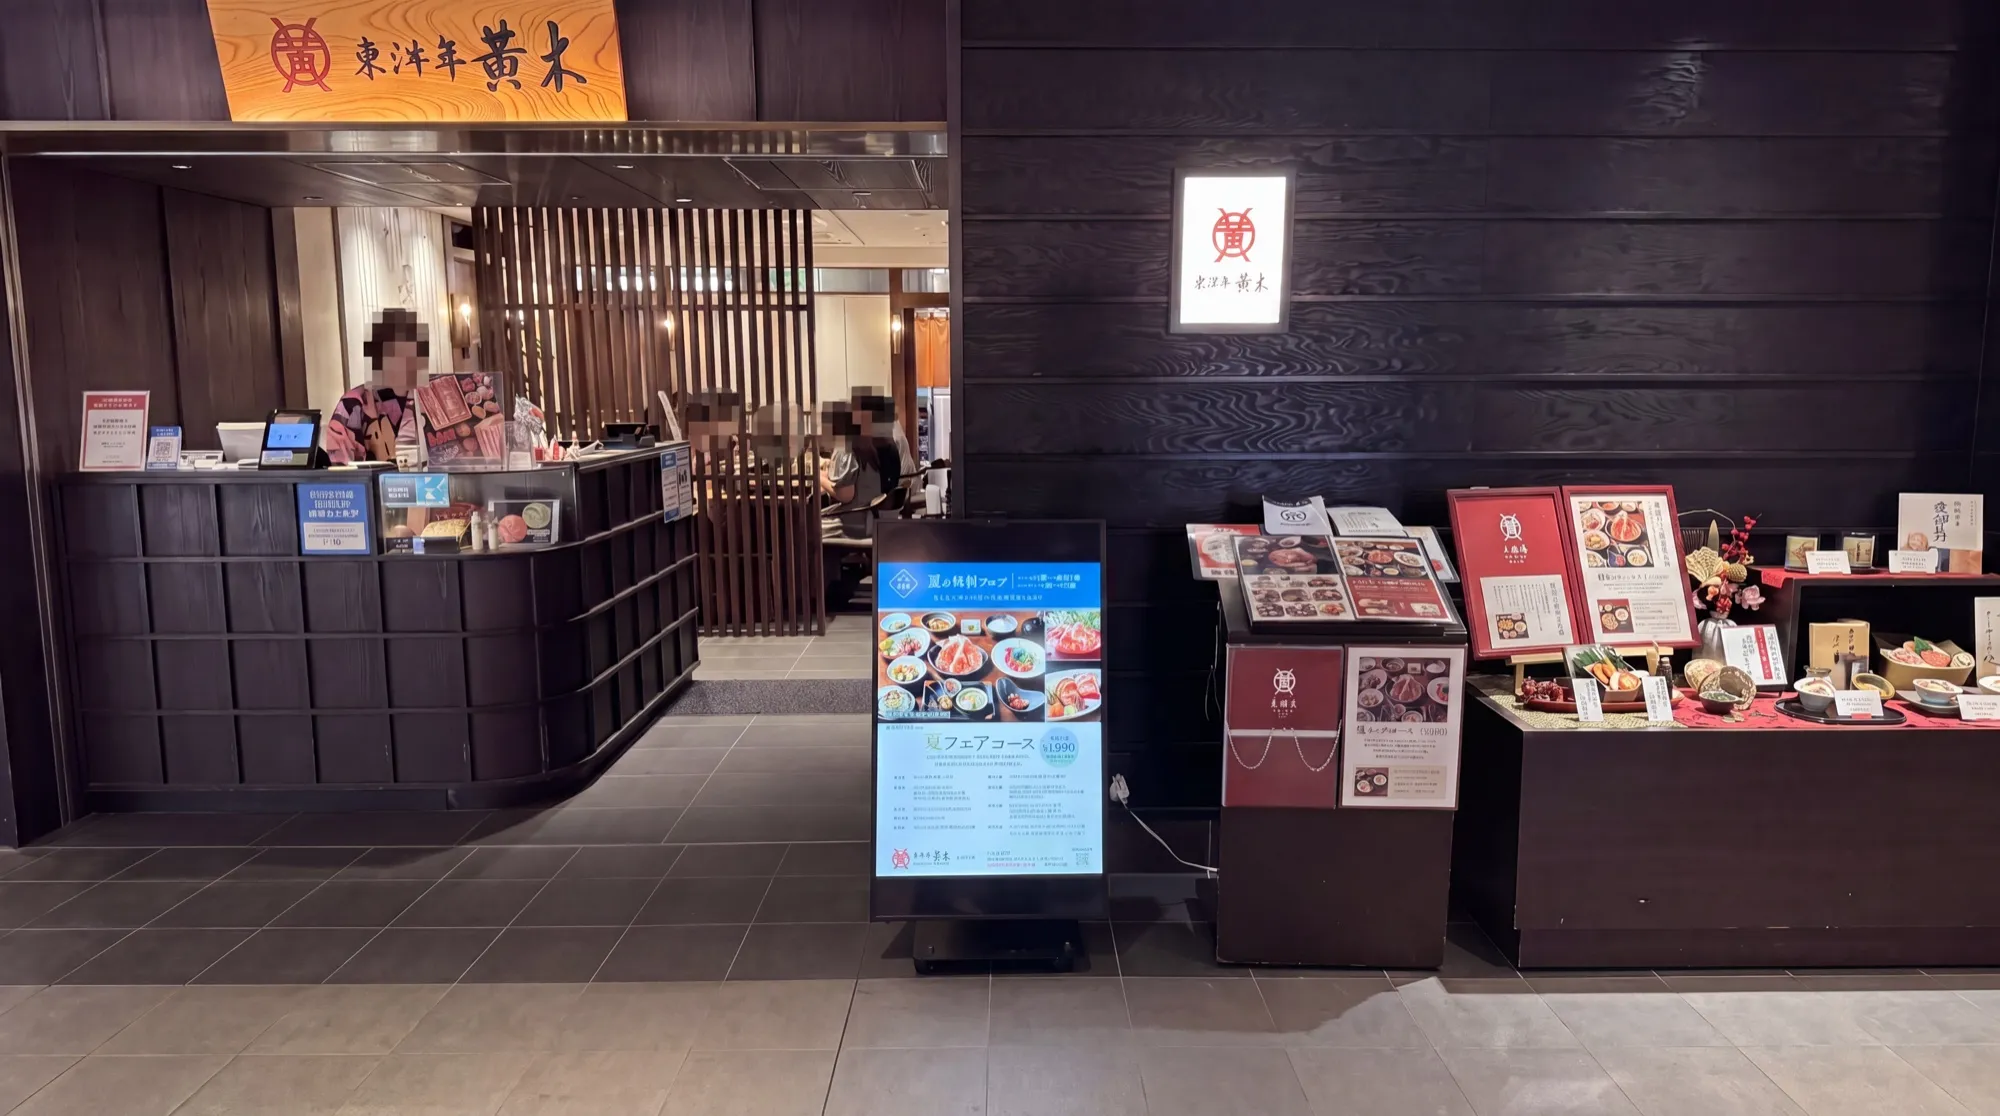
An illustrative view. In practice no footage is stored, and no one is identified or re-identified.
A ¥140,000 signage investment: visits +69%, sales +83%
Linking who saw the signage to who actually walked in showed that a ¥140,000 investment paid off.
Foot traffic lift
Revenue lift
Average attention on optimized content
¥140,000 spent on signage, with no idea what it did
O-KI is Japan's leading premium Yonezawa beef retailer, running seven boutiques where 70% of revenue comes from people who walk in off the street. It put ¥140,000 into storefront signage to win back traffic it was losing to nearby competitors, but had no idea which content worked or which hours underperformed.
Attention per creative, tied to entries at the door
SpaceVision installed StorefrontAI directly in front of the store entrance. It records attention rate and attention time per creative alongside entries by hour and weekday, linking specific content to people actually coming in. Video is processed inside the on-site device and erased immediately; only anonymous aggregates leave the store.
The path from content and time slot to sales became visible
With entry data per creative and performance by time slot in hand, O-KI confirmed the signage investment had paid off. Foot traffic rose 69% and revenue climbed 83%, with optimized content holding attention for an average of 8.7 seconds. Content is now scheduled by day of week and time of day.
Entry data per creative became the basis for scheduling
Investment check
See in numbers whether the signage investment turned into visits and sales.
Content scheduling
Compare attention time and entries per creative, then schedule by day and hour.
Rollout
Apply the same basis across the other boutiques and compare store performance.
Want the same data for your space?
Tell us the space and the period you want measured, and we will map out which metrics we can deliver first.