Measure category and shelf performance
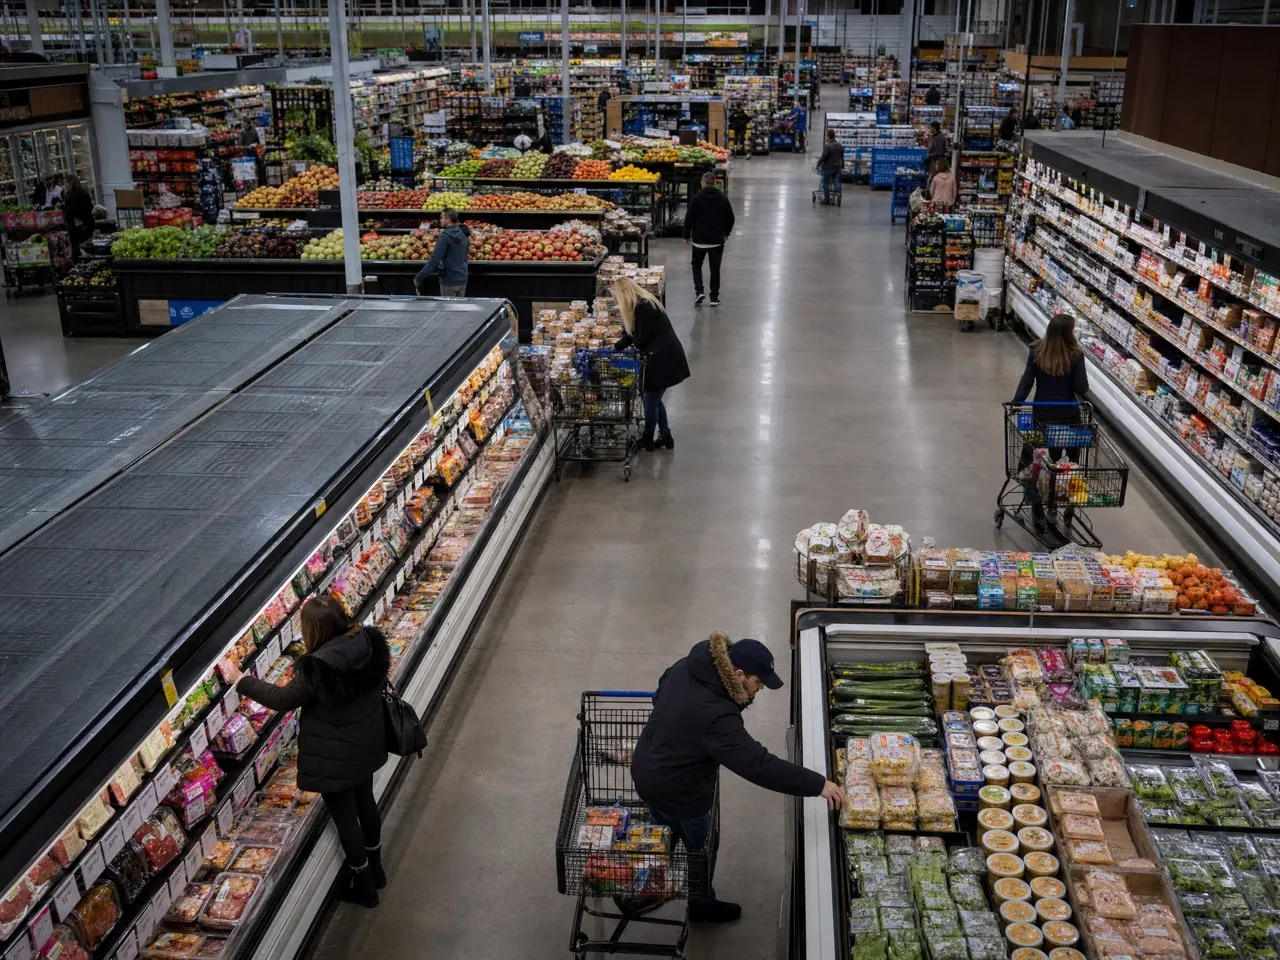
Grocery, hypermarket, and supermarket floors: which category zones hold dwell, which end-caps earn the look, and where in-store journeys break.
Operating questions
What category and store operations teams ask
- 01
Which stores convert the least traffic into entry and category dwell?
- 02
Which of end-caps, new products, and promo displays actually earn attention?
- 03
Can the layout and daypart routine of a top store be applied across the network?
In-store behavior POS cannot show
POS records transactions and basket size. Storefront traffic, entry, category dwell, and shelf attention only exist if they are measured.
How it is measured
Depending on the goal and the site, the setup uses a Slim Camera, a SpaceVision IP Camera, or existing IP cameras, connected to an AI Box or an on-site video processor. Original video is processed on site; only de-identified events and aggregates reach the dashboard.
Typical deployment options
Slim Camera + AI Box
Attention at close range, including signage and shelves
SpaceVision IP Camera + AI Box
New camera coverage for storefront, zone and journey measurement
Existing IP Camera + video processor
Traffic, dwell and spatial analysis using store CCTV
The setup, unit count and measurable area are confirmed after checking camera angle and resolution, occlusion, lighting and the store network.
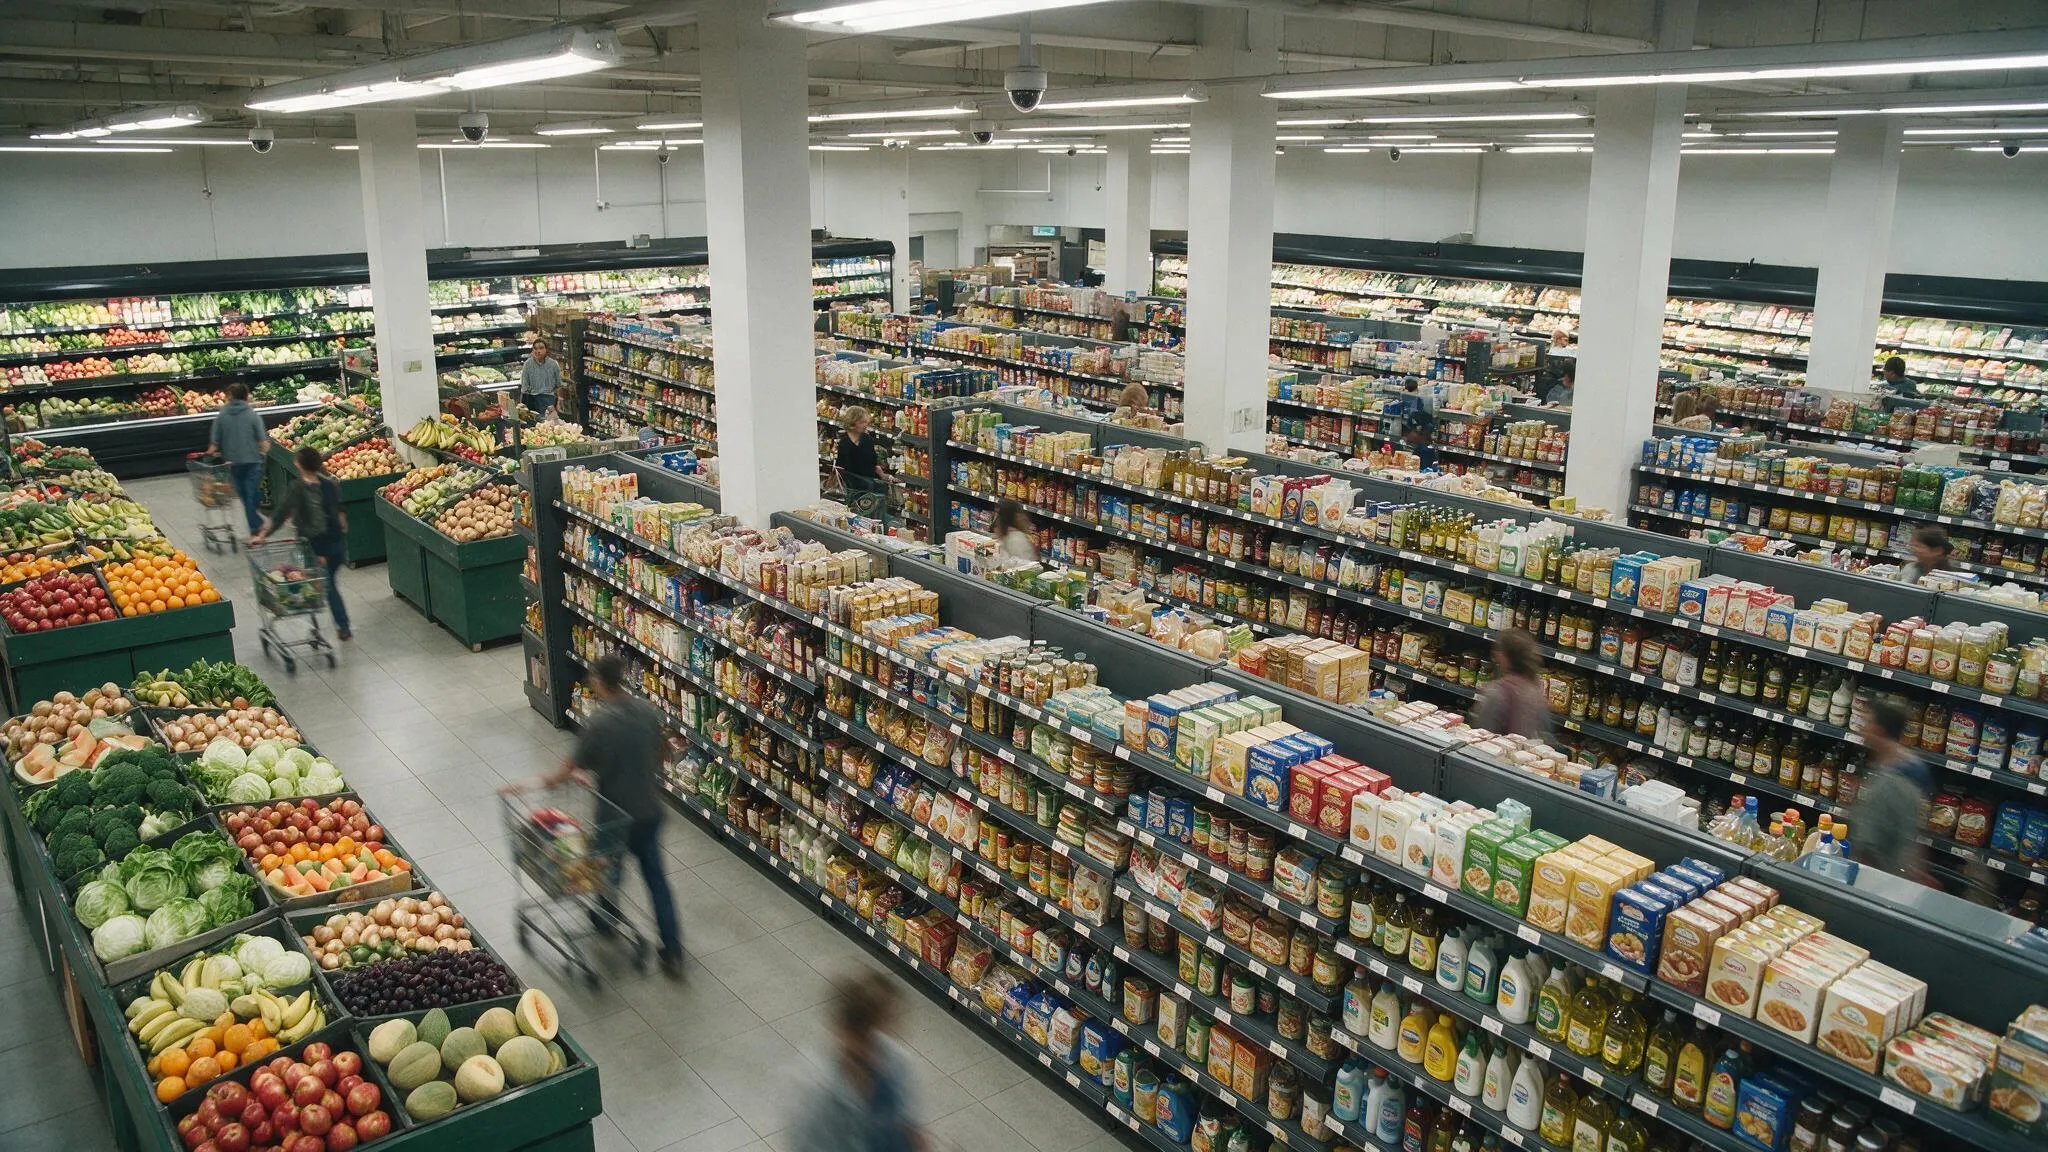
An illustrative view. In practice no footage is stored, and no one is identified or re-identified.
The six steps we measure
Pass · Glance · Attention · Entrance · Dwell · EngageWhat is measured
Traffic in front of the store versus actual entries
Time spent in fresh, packaged, beauty, health, and other category zones
Attention earned by end-caps, brand shelves, and feature displays
Stops, approaches, dwell, and observable interaction at try-out zones
Store traffic by morning, lunch, evening, and late night
De-identified aggregate composition of visitors
Where it is used
Behavioral metrics feed space allocation, display standards, and brand partner reporting.
Adjust category and shelf area to real dwell and paths
Roll out the layout of top stores across the network
Report shelf attention and try-out engagement to brands
Solutions this industry mostly uses
LotteMart uses 32 million daily verified impressions and a 16% Attention Rate to price campaigns across 175 stores.
Read case →Measure it in your stores
Start with a 2–3 month pilot configured for your site.