Measure attendee flow and dwell across lobbies, halls, and booths
Track the on-site journey from admission to booth visits, content attention, and sponsor activations.
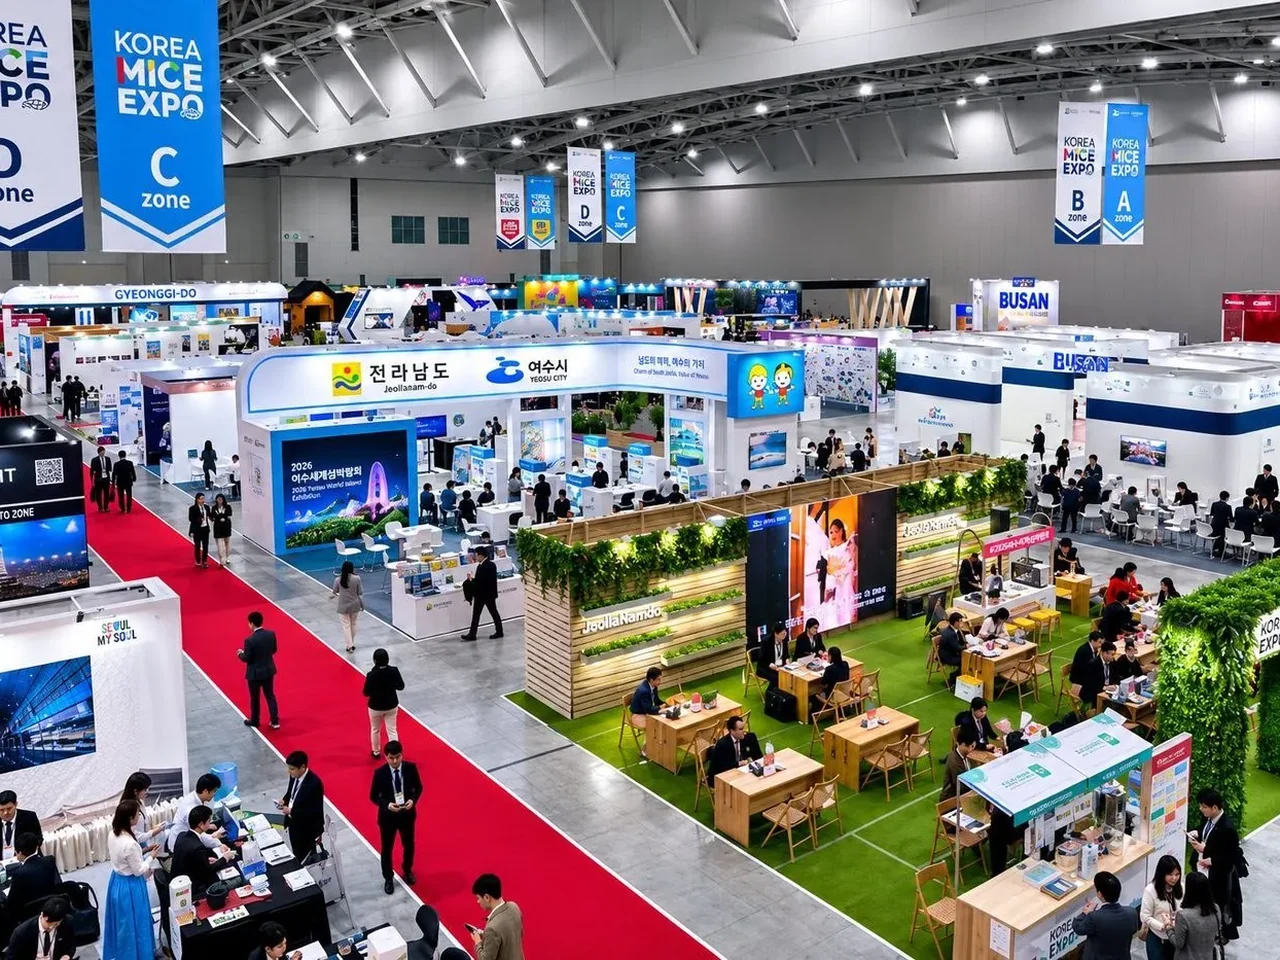
Operating questions
Questions for event operations and sponsorship teams
- 01
Which booths, exhibits, and activations make attendees stop and stay?
- 02
How does attendee flow connect entrances, lobbies, halls, and booths?
- 03
Can booth visits, stop rate, and dwell time be reported to sponsors and exhibitors?
On-site engagement that admission counts miss
Ticket and admission counts do not show show-floor traffic, booth visits, content attention, or dwell at sponsor activations.
How it's measured
Assess the measurement area and existing CCTV coverage, then configure the required cameras and on-site video processors. The on-site device processes original video and sends de-identified events and aggregates to the dashboard.
Typical deployment options
Slim Camera + AI Box
Attention at close range, including signage and shelves
SpaceVision IP Camera + AI Box
New camera coverage for storefront, zone and journey measurement
Existing IP Camera + video processor
Traffic, dwell and spatial analysis using store CCTV
The setup, unit count and measurable area are confirmed after checking camera angle and resolution, occlusion, lighting and the store network.
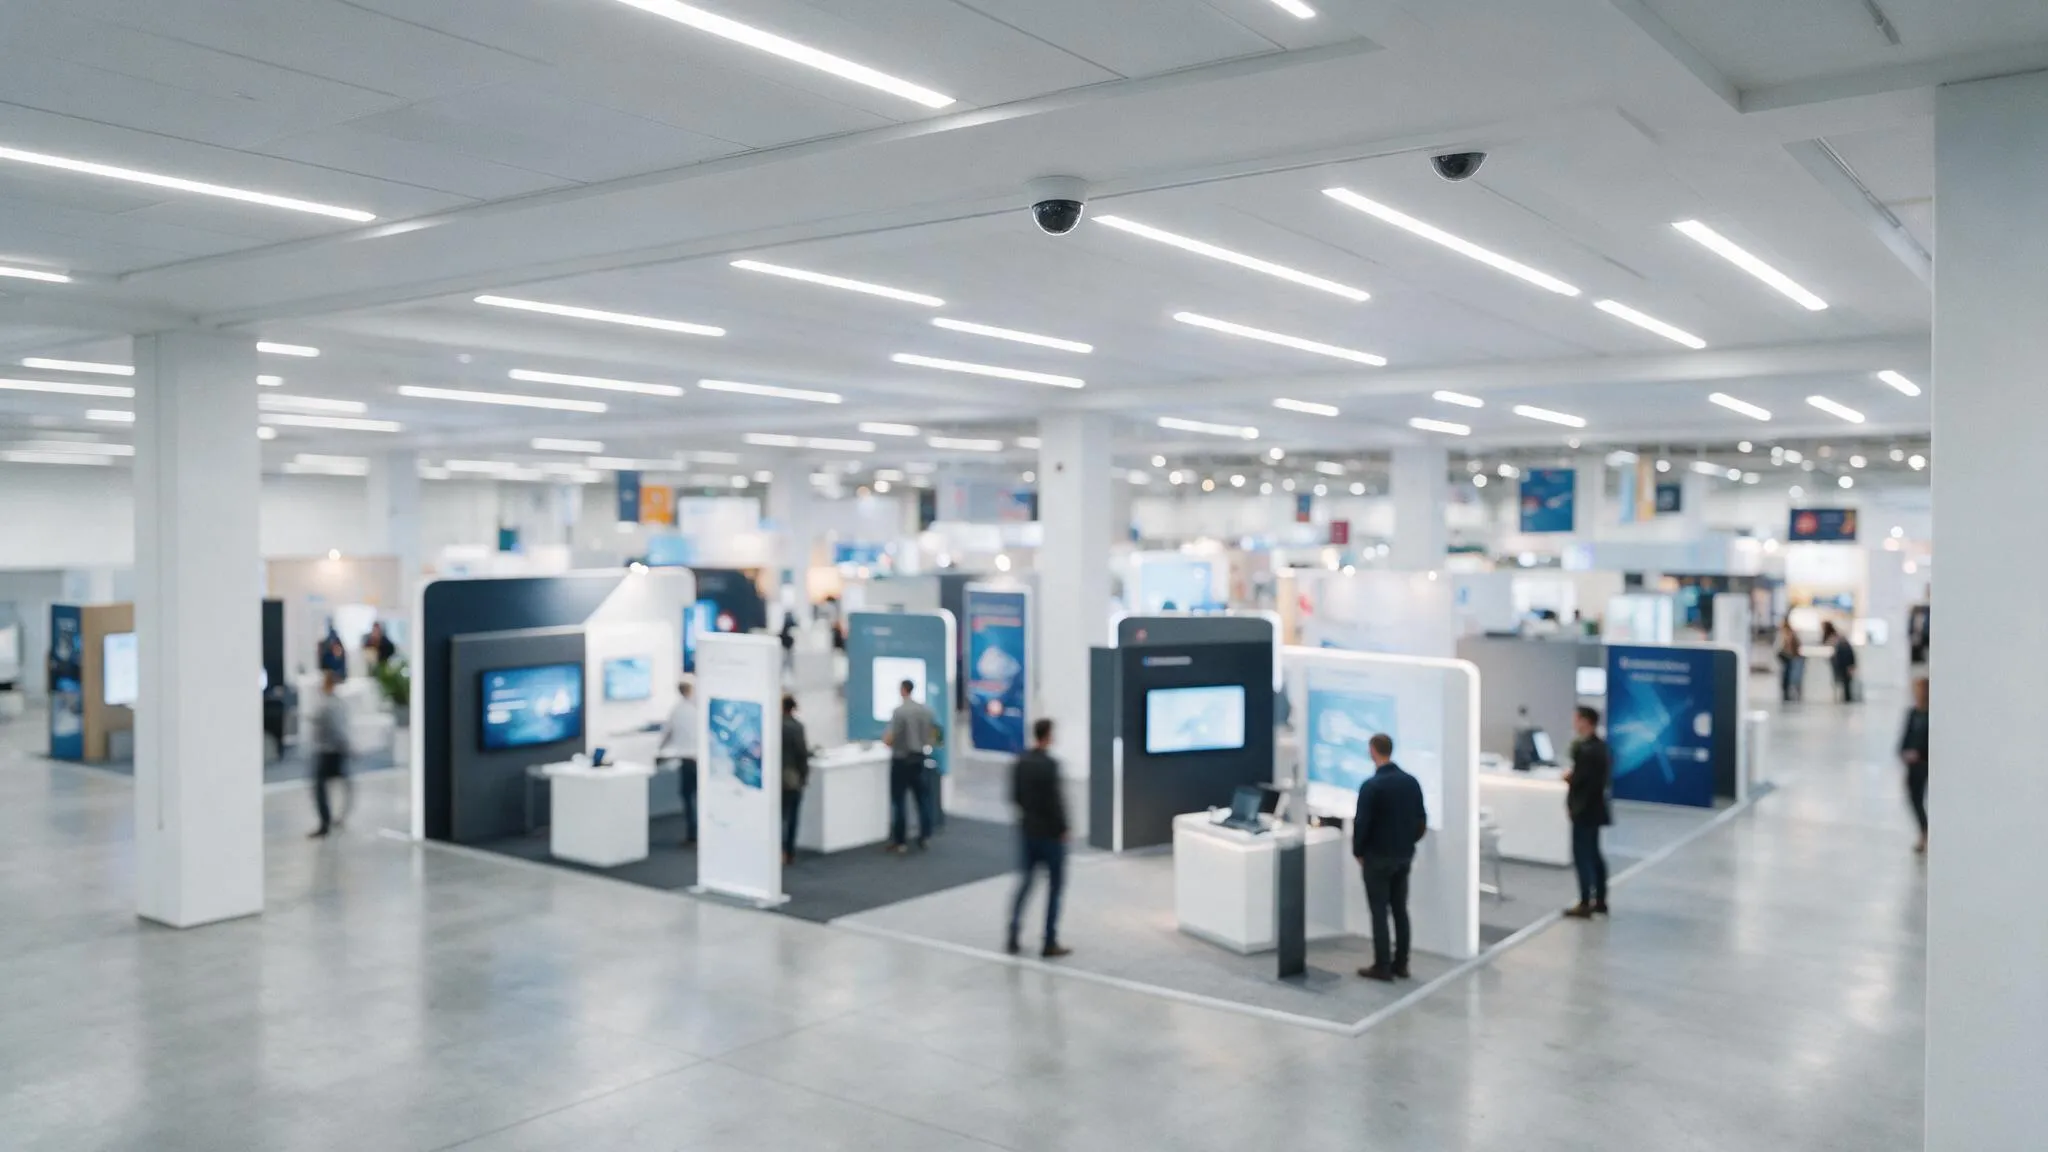
An illustrative view. In practice no footage is stored, and no one is identified or re-identified.
The six steps we measure
Pass · Glance · Attention · Entrance · Dwell · EngageWhat you measure
Attendee flow across lobbies, concourses, halls, and exhibition floors
The share of aisle traffic that approaches and stops at a booth
Time spent at exhibits, booths, and content areas
Attention captured by branded booths, signage, and activations
Traffic and congestion patterns by session, showtime, day, and hour
Broad attendee composition, de-identified and aggregated
Where it's used
Use on-site activity metrics for floor operations, sponsor and exhibitor reporting, and programming.
Place entrances, booths, and signage to reduce congestion and bottlenecks
Report booth visits, stop rate, dwell, and attention after the event
Adjust content and space programming to observed attendee response
Solutions this industry mostly uses
EventVision was deployed at flagship events among Roche's 300-plus exhibitions a year. Exhibition data utilization rose from 12% to 89%, and the pilot became an annual contract.
Read case →Reporting zone-level visits, dwell, and engagement for pop-ups lifted bid conversion 43% and client renewals 30%.
Read case →Measure it in your space
Start with a 2–3 month pilot configured for your site.