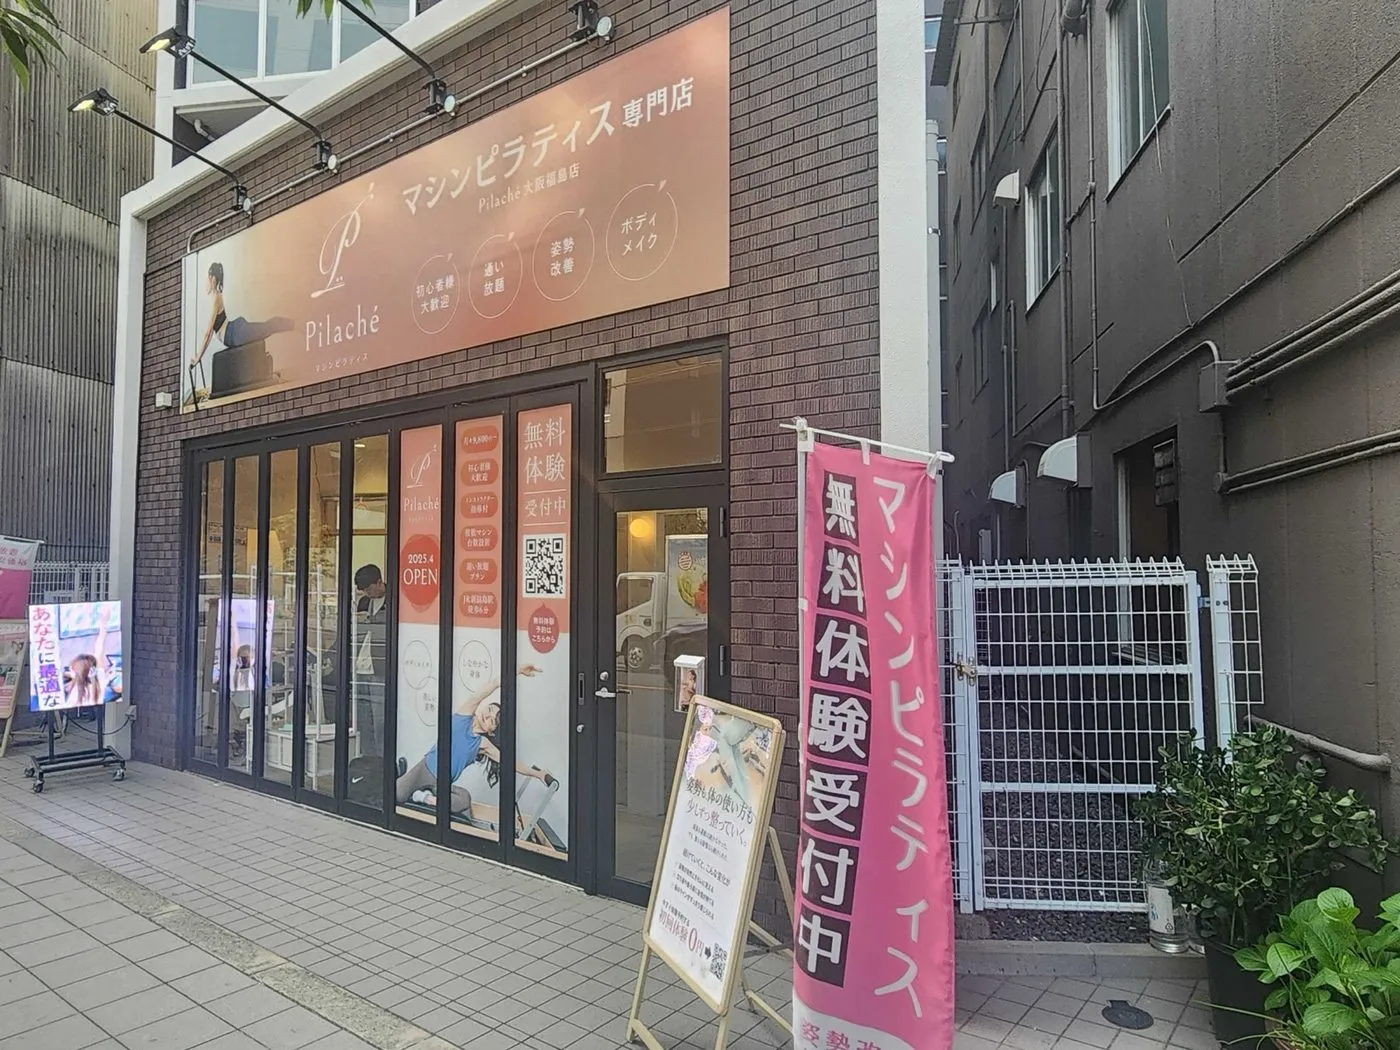
An illustrative view. In practice no footage is stored, and no one is identified or re-identified.
Peak and quiet hours were 2.6 times apart
More than 1,800 visits a month measured by time of day, feeding class scheduling and staffing.
Monthly measured visits
Gap between peak and quiet hours
Class times and staffing set by instinct
The studio set class times and staffing by instinct, with no way to see when people actually arrived across a day or a week. Quiet hours and busy hours blurred together, making it hard to put classes and staff where the demand was.
Visits split by hour and weekday to show demand
SpaceVision measured studio visits and split them by hour and weekday. When visits gather and when they fall away now reads at a glance. Video is processed inside the on-site device and erased immediately; only anonymous aggregates leave the studio.
Classes and staff placed against measured demand
The gap between peak and quiet hours turned out to be 2.6 times. The studio placed classes and staff against measured visits by hour, and uses the same figures as regular material in its operations meetings.
Hourly visit data became the basis for operating decisions
Scheduling
Put classes in the hours where demand actually is.
Staffing
Staff the busy hours and the quiet ones differently.
A standing input
Use the same visit data as a regular input to operations meetings.
Want the same data for your space?
Tell us the space and the period you want measured, and we will map out which metrics we can deliver first.