How to tell whether storefront signage brings shoppers inside
The effect of storefront signage is usually inferred from changes in sales. With the O-KI case, here is how measuring from the Pass count through Attention to Entrance as one flow lets you set content and time slots.
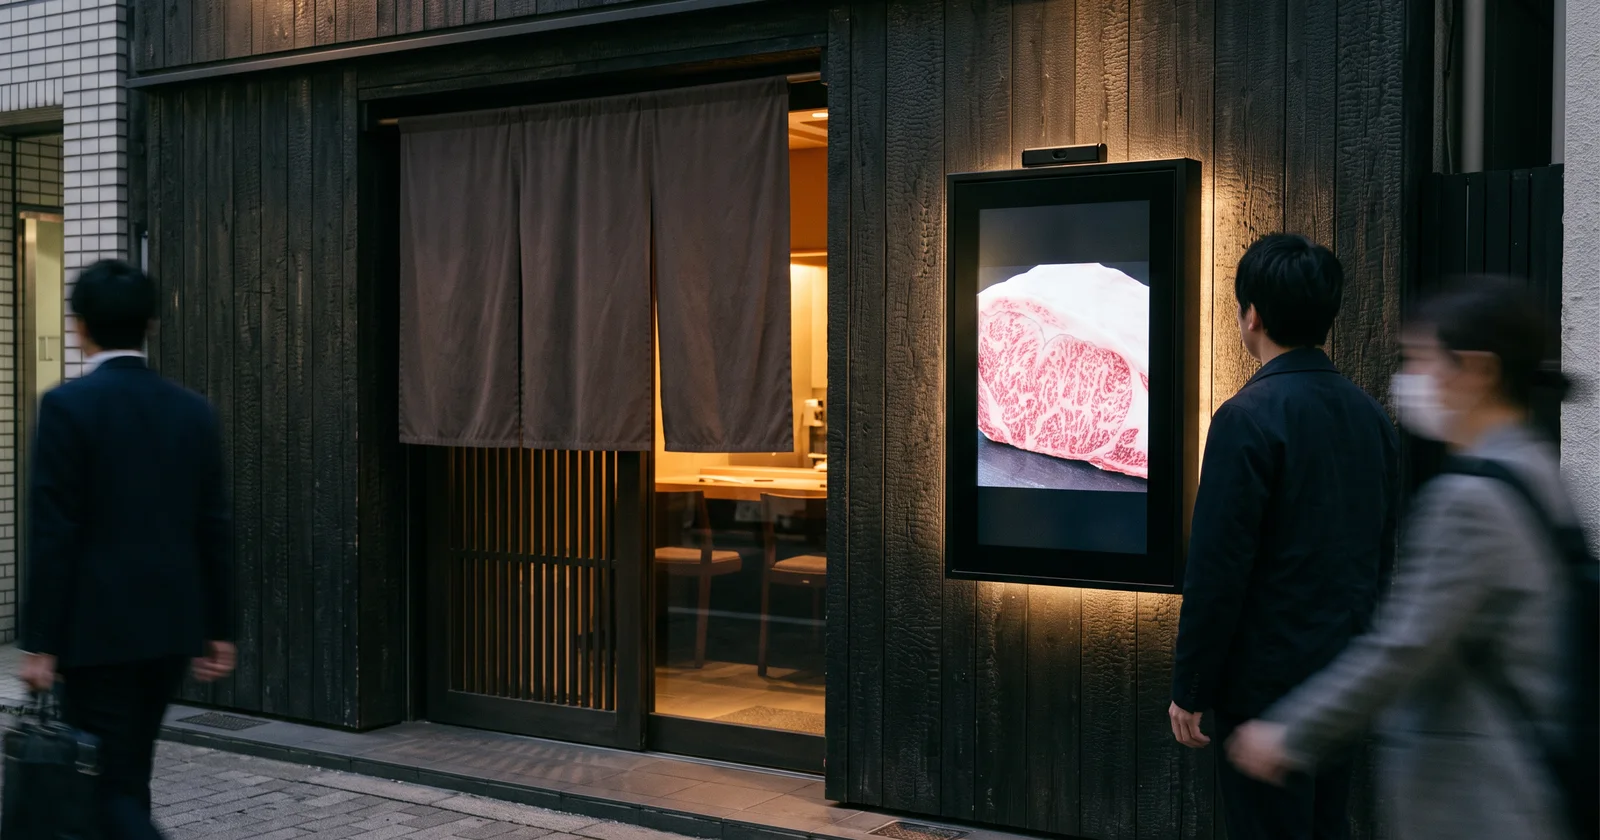
For stores with heavy passing traffic, the storefront is the most important sales space. That is why signage goes up beside the entrance to play menu or product videos. Whether that screen actually brings shoppers inside is hard to confirm. When sales rise, it is hard to tell whether the signage did it or the season or something else.
This post covers how to measure the storefront and the store interior as one flow, and a case where those numbers were used to set content and time slots.
Where the information breaks off at the storefront
When judging storefront signage, there are usually only two numbers at hand.
- Foot traffic estimates in front of the store: they do not separate people who looked at the screen from people who just walked by
- Sales and transaction counts: these are outcomes inside the store, so they cannot tell you whether a shopper came in because of the signage
What is missing is the part in between: of the people who passed the store, how many looked at the screen and how many came in. This is also where it is decided which videos work and which time slots are weak.
Measuring from the storefront through to Entrance
Small cameras on top of the storefront signage and at the entrance count the stages on the same timeline.
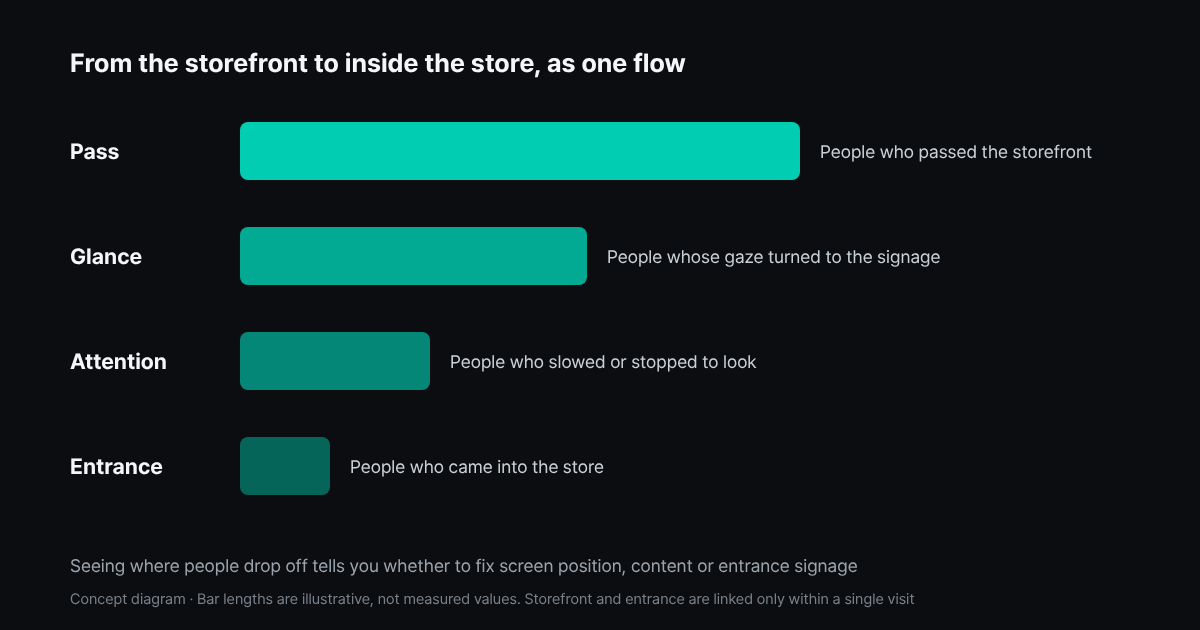
- Pass: people who passed the storefront
- Glance: people whose gaze turned toward the signage
- Attention: people who slowed or stopped to look at the screen
- Entrance: people who came into the store
People seen by the storefront camera and the entrance camera are linked only within that single visit. Video is processed on a device in the store, and the system is designed so that only anonymous aggregated counts are sent out.
What O-KI confirmed
O-KI is a premium Yonezawa beef specialist in Japan that runs several boutique stores. A large share of its sales comes from walk-in customers, so it invested in storefront signage to catch people heading to competitors nearby. It could not tell which content worked or which time slots were weak.
O-KI added measurement right in front of the store entrance and recorded attention by content alongside entrance by day and hour. Once it could see how content and time slots led to people coming in, it checked the return on its signage investment against the visitor counts the store took itself. It now adjusts the content schedule by day of week and time of day. The measurement period and results are in the case study.
What these numbers let you decide
- Which content to play. Compare the Attention count for each piece of content and the entrance that follows, and play the videos that brought people in more often
- What to play when. If lunch and dinner, or weekdays and weekends, bring different passersby, schedule different content for each time slot
- Where you lose shoppers. If the Pass count is high but few people glance, check screen position or brightness first. If many people pay attention but few come in, look at entrance signage or how the menu is displayed
Frequently asked questions
How many cameras do we need?
You can start with one. One camera at the storefront covers attention at the signage. Add one at the entrance and you can follow how many of the people who passed the store came in.
How long should we measure before judging the effect?
Storefront traffic swings with the day of week and the weather. To set a baseline, we recommend starting with a two to three month pilot, then changing content and comparing.
The storefront is where shoppers decide whether to come in. Measure that stretch, and you can decide in numbers what to play on the signage and when. See StorefrontAI for the full setup.